Chart history, Model Book, and journal
Keep group context, earnings data, chart states, and the later review connected.
A saved chart should still explain why you watched a stock later on. Price state, timeframe, drawings, and notes need to stay together for that.
This guide follows the path from group analysis through the chart and Model Book to the journal. The images show the features as you use them in WickedDesk.
Compare groups across timeframes
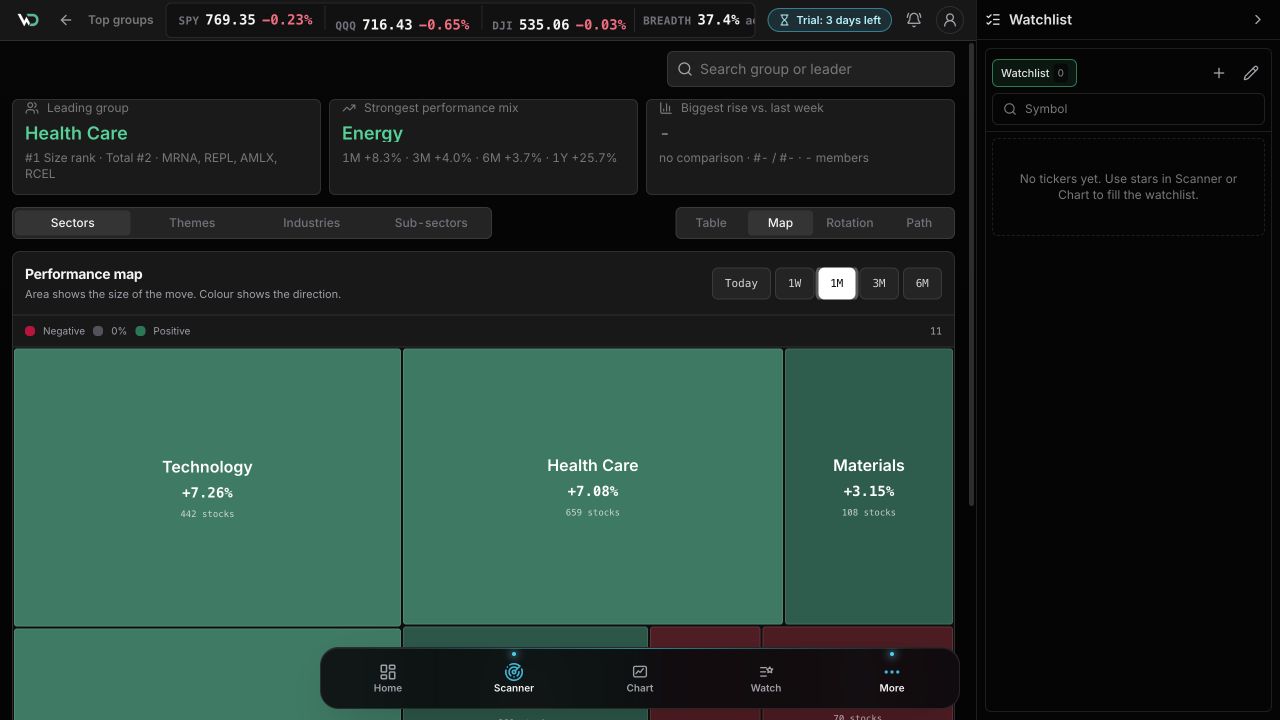
The performance map shows sectors, themes, industries, and sub-sectors as differently sized areas. Colour shows direction. Area shows the strength of the move in the selected period.
Switch between today, one week, one month, three months, and six months. A strong day inside a weak month may only be a short counter-move. Click a tile to open the stocks in that group.
Read the context beside the chart
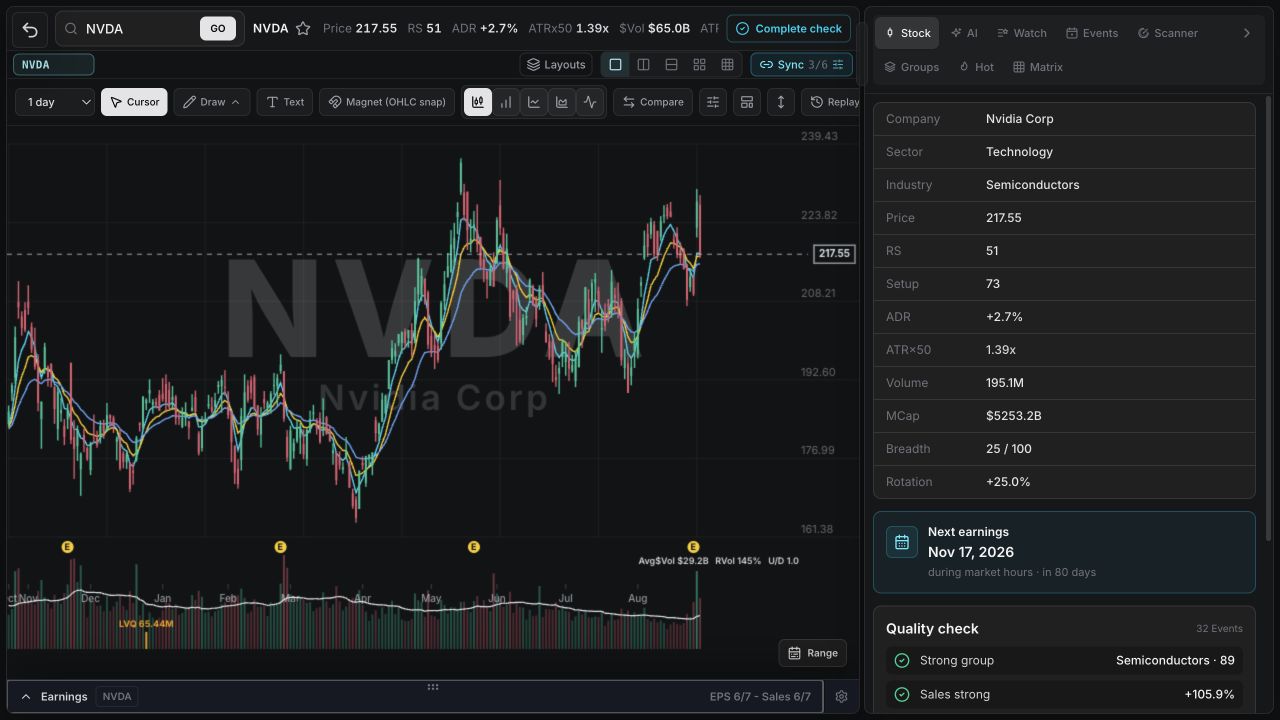
The sidecar brings together price, relative strength, ADR, volume, market cap, group breadth, and rotation. Relative strength, or RS, compares the stock with the market. ADR is the average daily trading range.
Below that, you see the next quarterly earnings date and the quality check. This shows which parts of the idea are confirmed and which are still missing without leaving the chart.

Check actual, estimate, and surprise
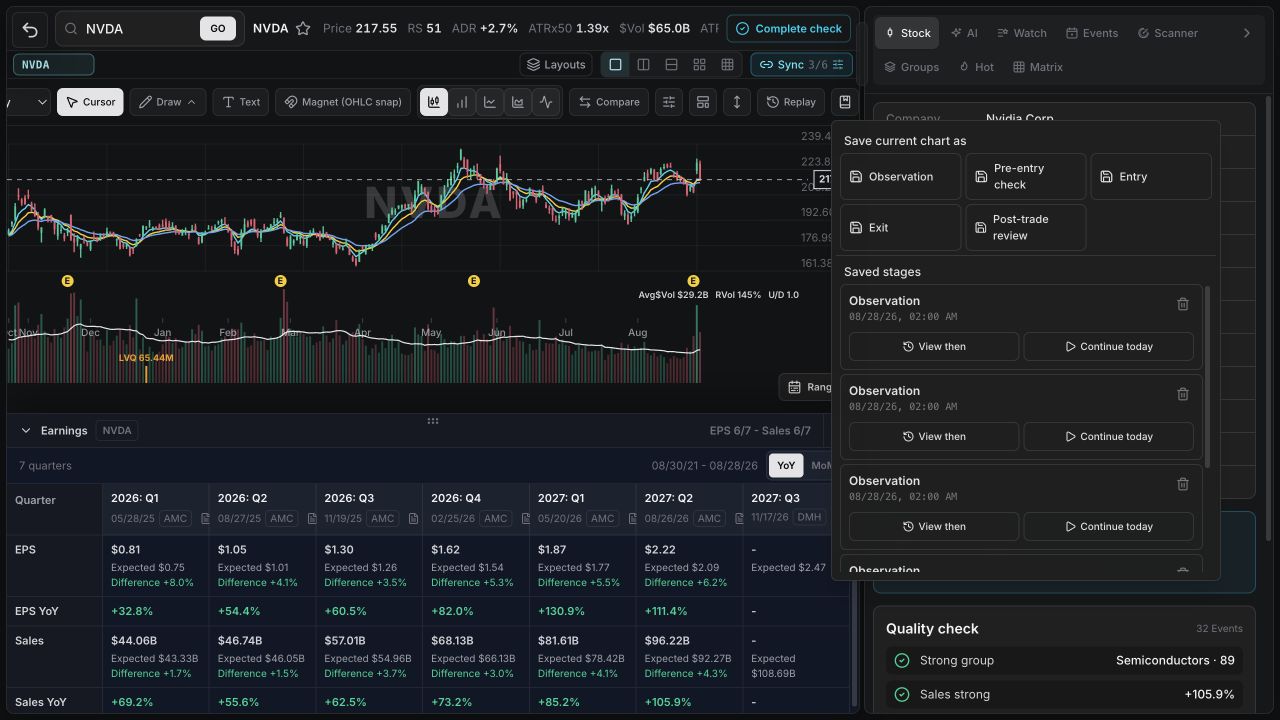
The earnings table shows the reported result, the prior market estimate, and the percentage surprise for EPS and sales. EPS means earnings per share. The next column shows the current estimate until the company reports.
Positive and negative surprises use different colours. The document icon opens the official SEC filing inside WickedDesk. On mobile, the table scrolls horizontally and vertically while metric names remain visible.
Save a chart as a stage
Save the chart as observation, pre-entry check, entry, exit, or post-trade review. WickedDesk keeps the symbol, data date, timeframe, chart type, visible range, indicators, and drawings.
View then opens the exact saved state. Continue today applies the same settings and drawings to current price data. The history syncs with your account and is available on your signed-in devices.
Send the current chart to Model Book
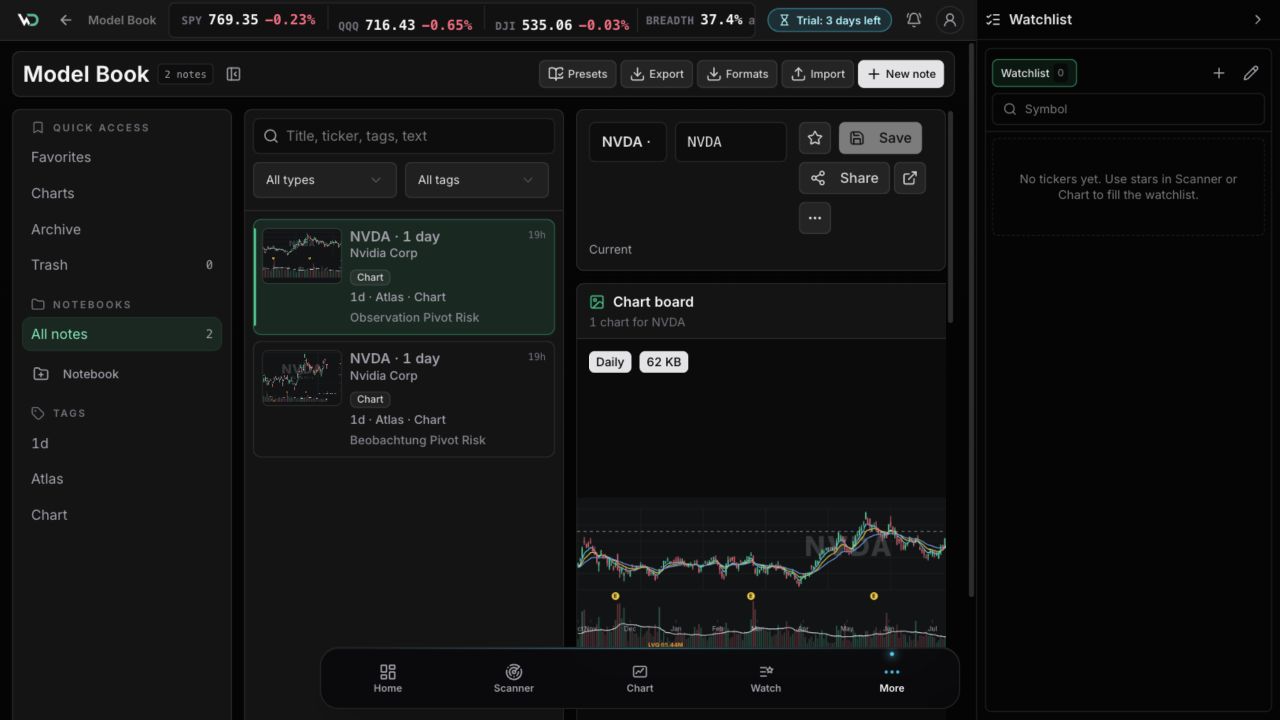
Model Book holds good and bad examples of recurring setups. Save the current Chart directly, including ticker, timeframe, and chart image.
Add thesis, pivot, and risk. The pivot is the price level whose break triggers your setup. Place the study in a notebook, then add tags or a rating. This makes similar examples easier to find than loose screenshots.
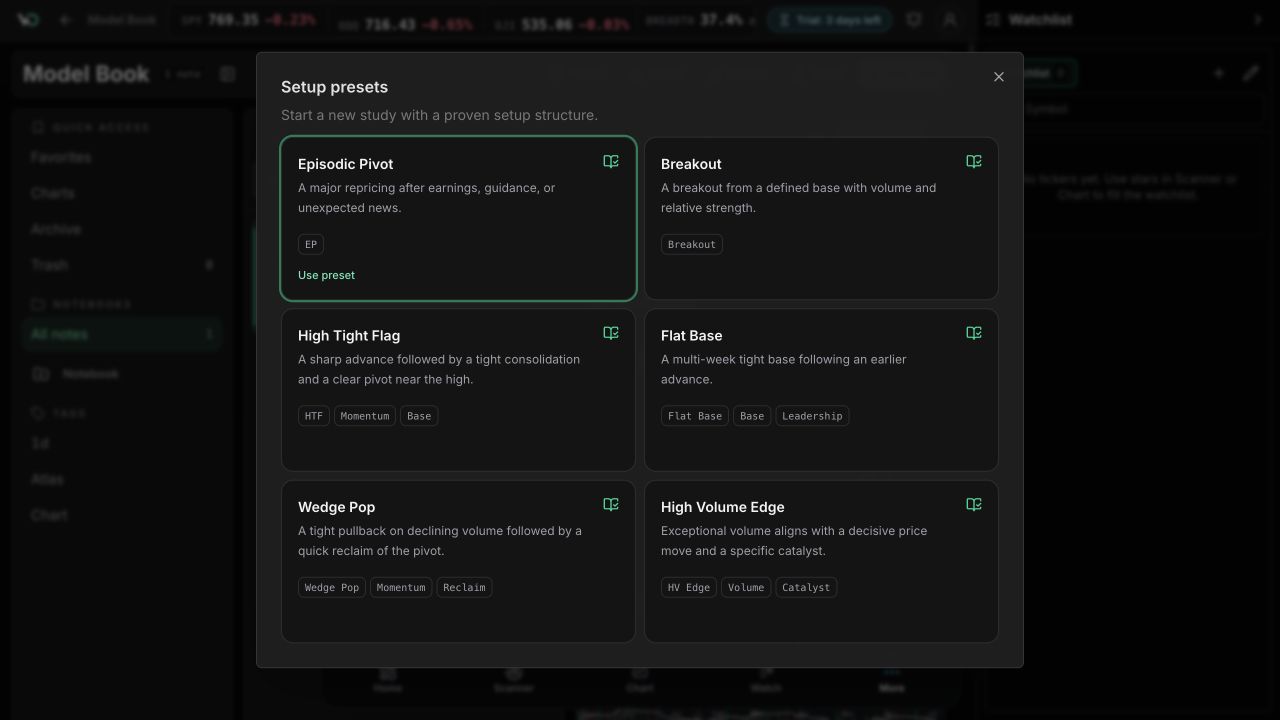
Use presets as a fixed checklist
Prepared structures are available for Episodic Pivot, Breakout, High Tight Flag, Flat Base, Wedge Pop, and High Volume Edge. They keep the questions consistent across similar setups.
A preset does not detect a setup or create a buy signal. It gives the analysis a stable form so examples can be compared later.
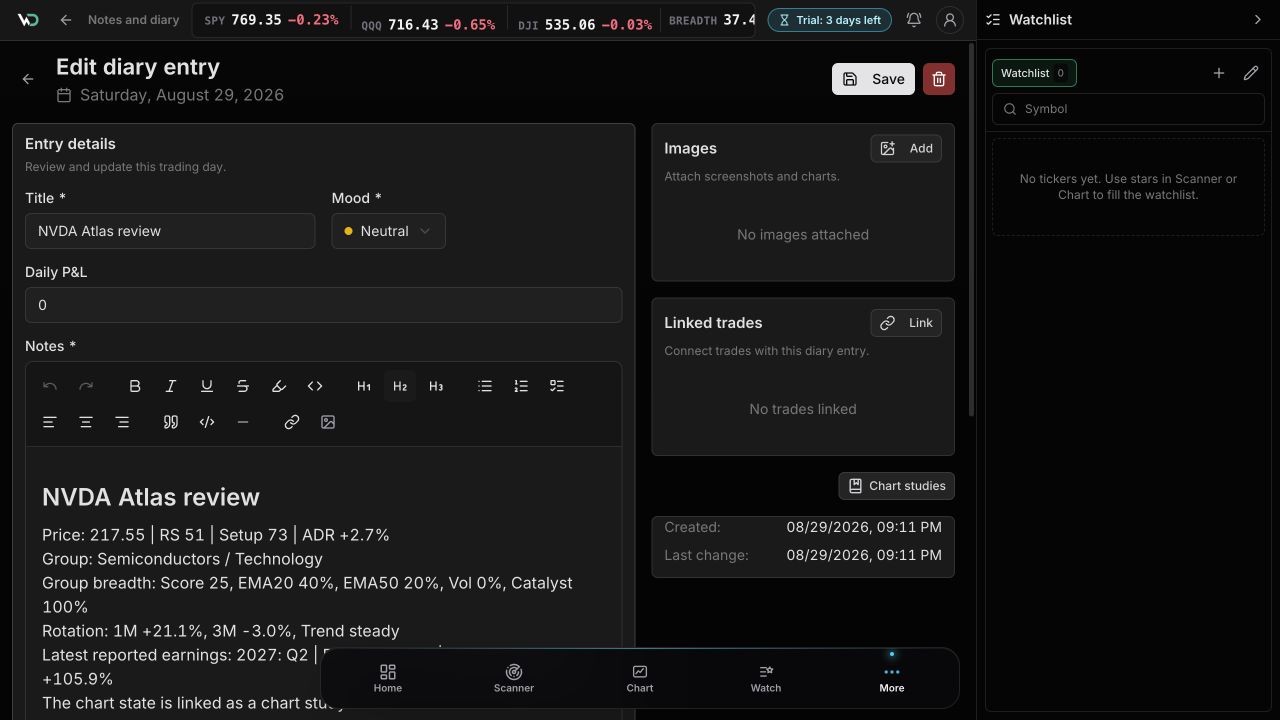
Send the chart to the journal
When you send a chart to the journal, WickedDesk prepares price, relative strength, ADR, group, rotation, earnings data, and the setup score. The setup score summarises the technical criteria you checked. You add the thesis, trigger, risk, and plan.
The saved chart state stays linked to the entry. Later, you can check which information was actually available when you made the decision.
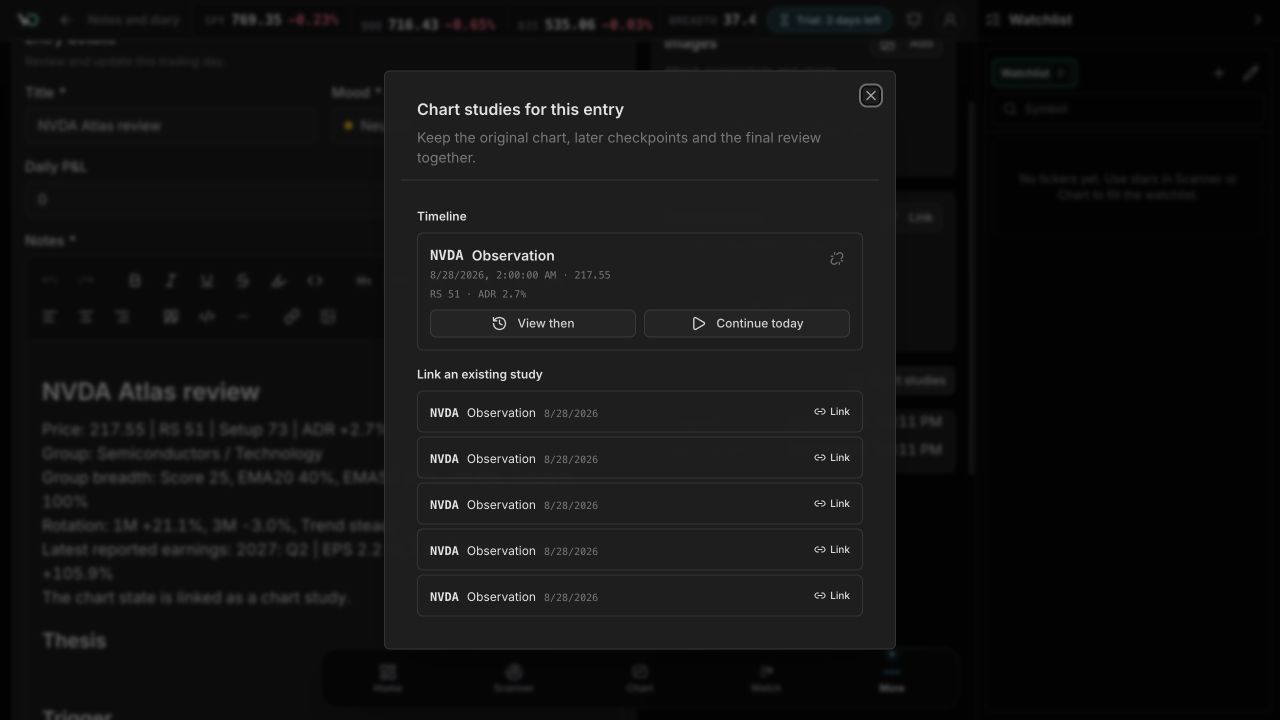
Compare then with today
The journal timeline opens the saved chart state or continues the review with current data. Further stages can be linked to the same entry.
This lets you compare the original chart with entry, exit, and post-trade review. You can check whether your original reasoning held up and turn a recurring observation into a rule for your playbook.
Workflow
Place the group
Choose a period and read the group move before the single stock.
Read chart and earnings
Check the sidecar, next date, actual, estimate, and surprise.
Save the chart state
Choose the right stage and keep drawings, levels, and timeframe.
File the example
Add it to Model Book with notebook, tags, thesis, pivot, and risk.
Connect the journal
Complete the plan and later compare the saved state with the outcome.