
The setup: acceleration or nothing
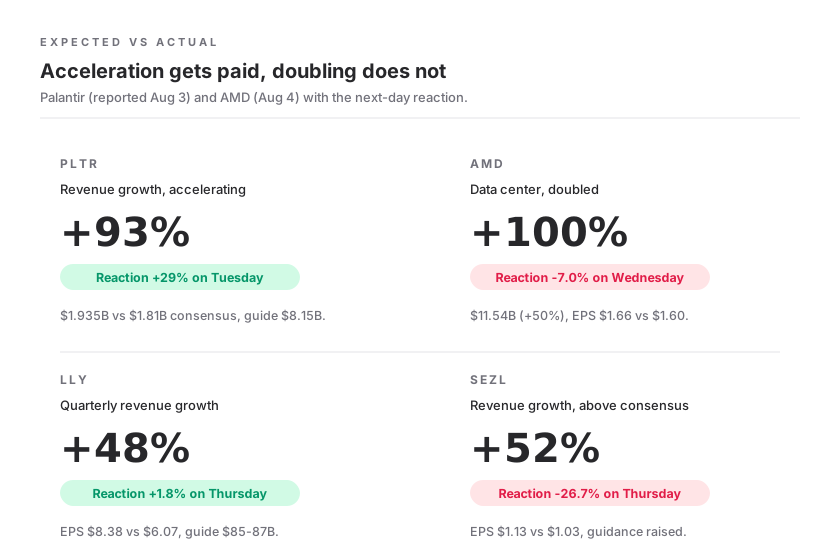
A week ago this magazine sorted the capex story: the market paid for spending only when utilization showed up in the same report. This week the bar moved again. Palantir reported $1.935 billion in revenue on Monday evening, 93% growth and faster than the prior quarter, and raised its full-year guide by roughly $490 million to $8.15 billion. The stock gained 29% on Tuesday. AMD delivered a double beat on Tuesday evening, $11.54 billion in revenue against an $11.25 billion consensus, with a data center business that doubled to $6.7 billion. The stock lost 7.0% on Wednesday. Doubling is no longer enough when the valuation demands acceleration.
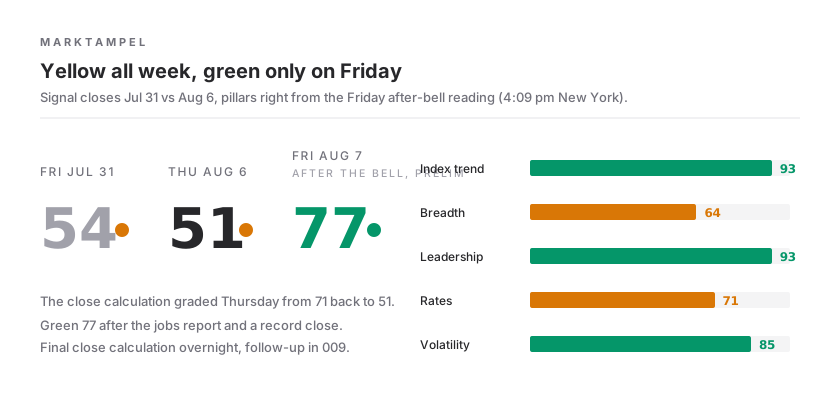
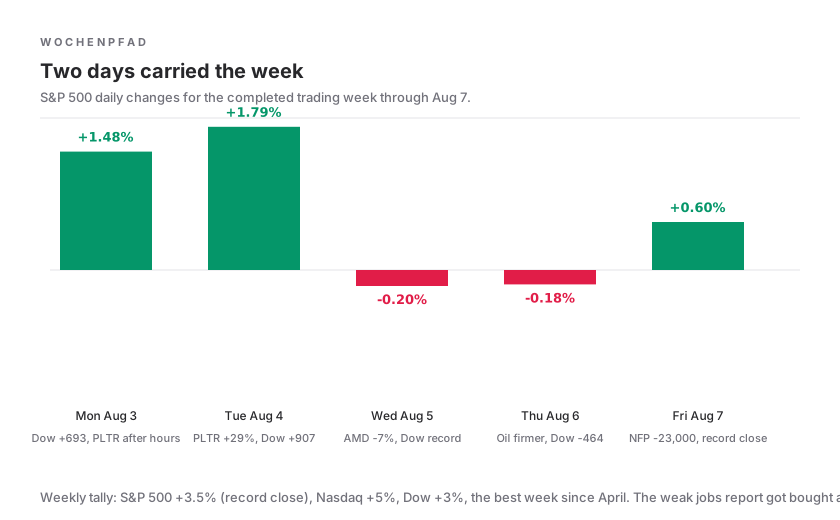
The indexes rewarded the week, but the distribution is lopsided. Through Thursday the S&P 500 stands at +2.9%, the Nasdaq at +3.8% and the Dow at +2.7%, and essentially all of it was earned on Monday and Tuesday. Wednesday and Thursday ran flat to slightly red, and on Thursday firmer oil and rising yields pushed the Dow down 464 points. The market signal graded those four days soberly, Monday 60, Tuesday 66, Wednesday 54, Thursday 51, yellow without an outlier, because breadth followed the index advance only reluctantly.
Friday then delivered, just not the way anyone expected. The jobs report showed minus 23,000 positions against an expected plus 83,000, the first decline in months, with unemployment at 4.1% and wage growth of 3.2%, the lowest since May 2021. Investors read the weakness as rate relief, the 10-year yield fell 5 basis points to 4.63%, and the move carried into the close: the S&P 500 gained 0.6% for a record close, the Nasdaq 1.3%, the Dow finished slightly higher. The week ends at S&P 500 +3.5%, Nasdaq +5%, Dow +3%, the best tally since April. The signal stood at 77 green after the bell and held it into Saturday morning. Preparation still means small positions and A setups only, because the detailed Friday breadth recompute was still pending and Thursday's revision showed how much a recalculation can move. Issue 009 carries the final figures.
From the desk: the blackout rule paid twice
A week ago this desk wrote that AMD was untouchable until Tuesday evening. The report came, the numbers were good, and the stock still lost 7.0% on Wednesday. It now sits 18% below its high and 6% below the 20-day line. There was never a position, and that is exactly what the rule is for. Sezzle made the same point louder: RS 98, 156% three-month momentum, a beat on revenue and earnings, raised guidance, and still minus 26.7% on Thursday plus another 33.4% on Friday to $118.02, more than a halving in two days. If you respected the blackout window, this week read as confirmation. If you wanted to argue with it, you now have one more example.
DELL remains the unfinished story. The stock holds RS 99, lost 4.7% on Thursday and took back 3.9% on Friday to $453.77. That is a wide, nervous base, and the tightness this desk has been waiting for since issue 006 has not formed, and a base that swings between four percent above and five percent below the 20-day line is not a base. The watch continues, nothing more.
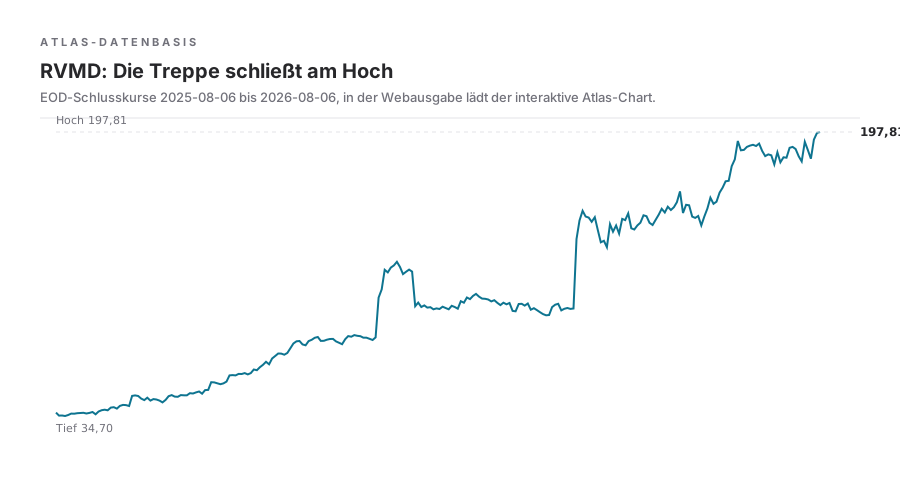
New on the list are the names that combine structure and liquidity. Revolution Medicines closed Thursday exactly at its 52-week high, with $386 million in daily dollar volume and a staircase instead of a vertical. Liquidia sits half a percent below its high with RS 99, carried by 143% three-month momentum. And Palo Alto Networks is the liquid answer to the software strength of the Palantir week without biotech volatility: $2 billion in daily dollar volume, 4.5% below the high, 96% momentum over three months. Nothing got bought before Friday's report, everything got planned. After the report, the close comes first, then the size.
| Symbol | RS | Watch | From High | Momentum 3M | To 20D Line | Dollar Volume |
|---|---|---|---|---|---|---|
| AMD | 96 | Blackout rule paid, report -7.0%, structure only interesting again above the 20-day line | -18.2% | +35% | -6.1% | $24.3B |
| DELL | 99 | Thursday -4.7%, Friday +3.9% to 453.77, the base stays wide, the tightness from 006 still missing | -10.1% | +83% | +3.8% | $3.1B |
| RVMD | 99 | Friday +3.7% to 205.15, fresh high above the zone, Atlas study in this issue | 0.0% | +105% | +13.7% | $0.39B |
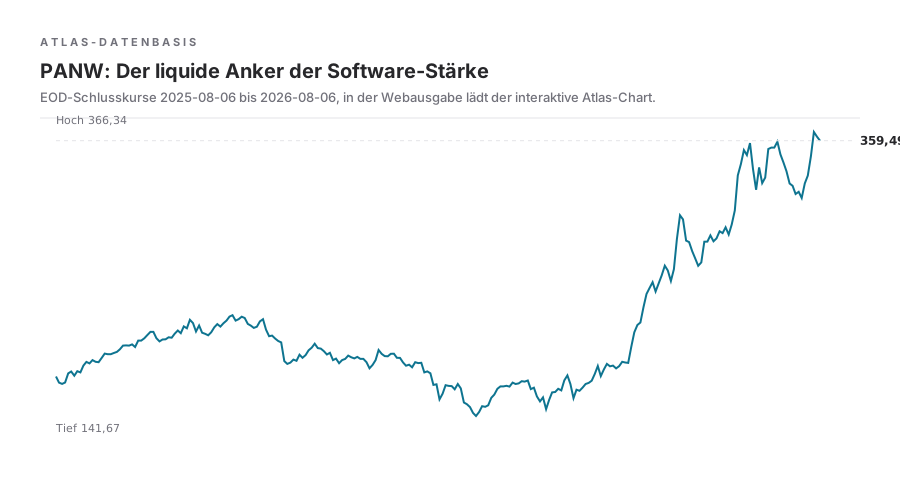
| PANW | 98 | Liquid anchor of software strength, Atlas study in this issue | -4.5% | +96% | +6.3% | $2.0B |
- RS
- 96
- Watch
- Blackout rule paid, report -7.0%, structure only interesting again above the 20-day line
- From High
- -18.2%
- Momentum 3M
- +35%
- To 20D Line
- -6.1%
- Dollar Volume
- $24.3B
- RS
- 99
- Watch
- Thursday -4.7%, Friday +3.9% to 453.77, the base stays wide, the tightness from 006 still missing
- From High
- -10.1%
- Momentum 3M
- +83%
- To 20D Line
- +3.8%
- Dollar Volume
- $3.1B
- RS
- 99
- Watch
- Friday +3.7% to 205.15, fresh high above the zone, Atlas study in this issue
- From High
- 0.0%
- Momentum 3M
- +105%
- To 20D Line
- +13.7%
- Dollar Volume
- $0.39B
- RS
- 98
- Watch
- Liquid anchor of software strength, Atlas study in this issue
- From High
- -4.5%
- Momentum 3M
- +96%
- To 20D Line
- +6.3%
- Dollar Volume
- $2.0B
Market signal: yellow all week, green only on Friday morning
The final daily closes draw an unexcited week, Friday 54, Monday 60, Tuesday 66, Wednesday 54, Thursday 51. The jump to 71 that Thursday's intraday reading showed did not survive the final calculation, the recompute graded the day back to 51, and this issue states that difference openly instead of smoothing it. Four days of index rally and no movement in the signal, that tension was the week.
Friday resolved it, subject to the recompute. After the negative jobs report the signal turned green and stood at 77 after the bell, carried by an index trend pillar at 93, leadership at 93 and breadth rising to 64. It is the first green reading in weeks, and the index underlined it with a record close. The value survived the night into Saturday unchanged, yet one reservation stays: the detailed Friday breadth recompute was still pending on Saturday morning, and Thursday's revision from 71 to 51 showed how hard a recalculation can correct. For the process that still means small positions and A setups only, until issue 009 sets the final value against this reading.
Index picture: the entire gain came from two days
Monday opened the week with force. The S&P 500 gained 1.48% to 7,600.50, the Nasdaq 2.1% to 25,913.90, the Dow 693 points to 53,178.41. After the close Palantir reported, and Tuesday turned that into the strongest day of the week: S&P 500 +1.79% to 7,736.52, Nasdaq +2.59% to 26,584.99, Dow +907 points to 54,085.88, while Palantir itself gained 29% and short sellers took roughly $3 billion in losses according to press reports.
From Wednesday on, the fuel was gone. The S&P 500 slipped 0.2%, the Nasdaq 0.8%, and only the Dow pushed 263 points higher to a record 54,349, carried by Eli Lilly and the rotation into the second tier. Thursday ended the streak: Dow -464 points to 53,885.10, S&P 500 -0.18% to 7,709.96, Nasdaq -0.06% to 26,348.35, with firmer oil and rising yields. Through Thursday the week stands at S&P 500 +2.9%, Nasdaq +3.8%, Dow +2.7%. That is a good tally on a lopsided base, because Wednesday and Thursday contributed nothing.
Friday belonged to the rate side and carried into the close. After the jobs report yields fell 5 basis points to 4.63%, the S&P 500 gained 0.6% for a record close, the Nasdaq added 1.3% and the Dow finished slightly higher. The weekly tally: S&P 500 +3.5%, Nasdaq +5%, Dow +3%, the best week since April for all three indexes.
Week calendar: what was due and what came of it
The trading week is complete, with the jobs report and the Friday close worked in. Each row sets the expectation before the event against the actual value and the market reaction; open fields stay blank and run as a follow-up check in issue 009.
What Changed The Weekly Plan
Palantir Q2, after hours
Eli Lilly Q2, ADP report
July jobs report, 8:30 ET
Earnings calendar: this week's reactions, next week's dates
The completed reactions of this reporting week come first, followed by the open dates of the next. Open actuals stay blank and will be checked against the real reaction in issue 009.
Economic calendar: before and after
This week's macro calendar was short and hung on employment. Wednesday's ADP number lowered the expectation for the official report, and Friday decided it with the first payroll decline in months; the closing reaction runs in issue 009. Open fields run as a follow-up check in issue 009.
What Changed The Weekly Plan
ADP employment, July
July jobs report (NFP)
US 10-year yield
Breadth: two buying days, one setback
The start of the week answered the question issue 007 asked, just not with the required force. The demand was a second day with more than 800 stocks up over 4%. Monday delivered 573 and Tuesday 725, two genuine accumulation days below the bar. The share of stocks above the 50-day line climbed from 46.7% to 55.8% on Tuesday and slipped over 54.5% on Wednesday to 51.6% on Thursday. That is the best breadth in weeks, and through Thursday it stayed below the level that would carry a color change.
Wednesday and Thursday cooled without tipping over, 257 against 202 and then 299 against 277 stocks up more than 4%, two flat days after two strong ones. Friday brought fresh push after the jobs report, the signal's breadth pillar rose to 64, and the index confirmed with a record close. The final Friday breadth counts arrive with the overnight recompute, issue 009 carries them. The test for next week stays the same: an accumulation day has to stand instead of being sold the next session.
Rotation: cyclicals in, defensives out
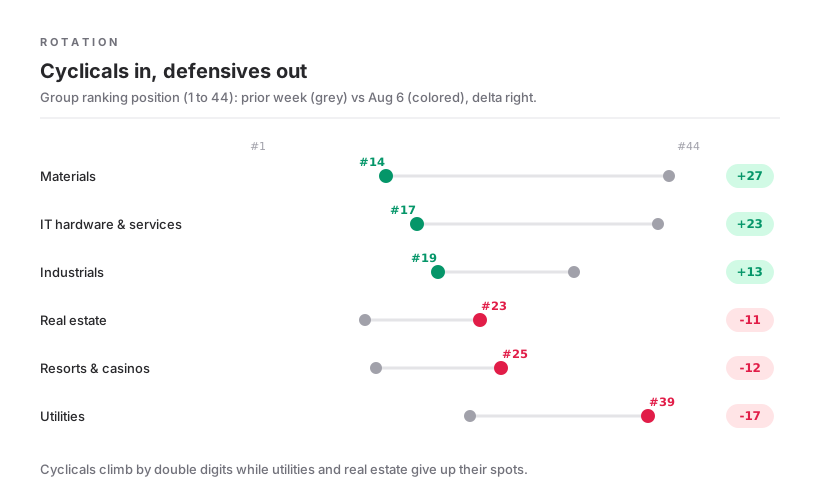
The group ranking shows the clearest rotation in weeks, and it has one direction. Materials jump from 41st to 14th, IT hardware and services from 40th to 17th, industrials from 32nd to 19th. On the other side the defenders leave: utilities fall from 22nd to 39th, real estate from 12th to 23rd, resorts and casinos from 13th to 25th. Investors bought cyclical sensitivity this week and sold rate safety, which fits the reclaimed index trend and the lower weekly yield.
At the top of the ranking the prior weeks' groups remain, personal services, department stores with Macy's, Kohl's and Dillard's, and the technology distributors as the receiving end of the capex cycle. That is not a new leadership, it is a broader base under the existing one. The advance is recruiting from the second tier while the first tier digests its reports.
Group ranking: the top spots and their receipts
Ranked by the group engine's strength score, prior-week rank from the archived snapshot of the same engine. The group cut was reworked this week and is coarser than issue 007's industry cut; week-over-week comparisons stay consistent within this engine, see methodology.
| Group | RS | Rank | Prior | Leaders | Receipt | Strength | Momentum 1M |
|---|---|---|---|---|---|---|---|
| Personal Services | 93 | 1 | 1 | ANDG | Single-name leadership, thin but stable at the top | 91 | +30% |
| Department Stores | 82 | 2 | 4 | M, KSS, DDS | Three liquid names, defensive consumption with momentum | 90 | +17% |
| Technology Distributors | 78 | 3 | 2 | NSIT, ARW, SCSC | Receiving end of the capex cycle, in front for three issues now | 88 | +14% |
| Financial Services | 56 | 6 | 8 | MAAS, SEZL, LIFE | A riser, but SEZL shows the group's event risk | 73 | +5% |
| Software | 52 | 7 | 11 | APPS, RXT | The Palantir week lifts the group four spots | 69 | +5% |
| Materials | 51 | 14 | 41 | Biggest riser of the week, the cyclical rotation in one line | 58 | +13% |
- Personal Services
- RS
- 93
- Rank
- 1
- Prior
- 1
- Leaders
- ANDG
- Receipt
- Single-name leadership, thin but stable at the top
- Strength
- 91
- Momentum 1M
- +30%
- Department Stores
- RS
- 82
- Rank
- 2
- Prior
- 4
- Receipt
- Three liquid names, defensive consumption with momentum
- Strength
- 90
- Momentum 1M
- +17%
- Technology Distributors
- RS
- 78
- Rank
- 3
- Prior
- 2
- Receipt
- Receiving end of the capex cycle, in front for three issues now
- Strength
- 88
- Momentum 1M
- +14%
- Financial Services
- RS
- 56
- Rank
- 6
- Prior
- 8
- Receipt
- A riser, but SEZL shows the group's event risk
- Strength
- 73
- Momentum 1M
- +5%
- Software
- RS
- 52
- Rank
- 7
- Prior
- 11
- Receipt
- The Palantir week lifts the group four spots
- Strength
- 69
- Momentum 1M
- +5%
- Materials
- RS
- 51
- Rank
- 14
- Prior
- 41
- Receipt
- Biggest riser of the week, the cyclical rotation in one line
- Strength
- 58
- Momentum 1M
- +13%
Personal Services
Stärke 91, Vorwoche ebenfalls Rang 1; Einzelwert-Führung, dünn besetzt.
Dossier: the bar is called acceleration
Palantir and AMD sat the same exam in the same week and received two different grades. Palantir grew 93% and faster than the prior quarter, raised its full-year guide by half a billion dollars and reported 149% growth in US commercial. The answer was a 29% single-day gain, roughly $3 billion in short-seller losses per press reports, and another 10.2% on Friday to $172.01, 37% above the pre-report close. AMD grew 50%, doubled its data center business to $6.7 billion and beat consensus on revenue and earnings. The answer was minus 7.0%.
The difference is not the quality of the numbers but the ratio of numbers to expectation. AMD traded into the report at a valuation that assumed acceleration and delivered confirmation. Palantir delivered surprise. For weekly preparation the rule from issue 007 sharpens: this earnings season does not pay for good results, it pays for a positive second derivative. Holding positions through report dates is not a bet on good numbers, it is a bet on beating the expectations of an entire market. The invalidation of this thesis would be a series of reports where solid confirmation gets bought again, visible in positive next-day reactions despite unchanged guidance.
Dossier: the storage trade breaks
In July, memory and storage were among the strongest corners of the tape, Micron, Western Digital and Sandisk carried RS ratings of 98 and 99. This week the structure broke. Western Digital lost 12% on Thursday and sits 43% below its 52-week high, 13% below the 20-day line. Sandisk gave up 5.6% and trades 48% below its high with minus 29% one-month momentum. Micron holds up better but sits 30% below its high and just under the 20-day line.
The read is uncomfortable for anyone who treats the RS rating as the only criterion: all three names still carry ratings of 98 or 99 because the ranking weighs twelve months of history. The charts say the opposite, broken bases, distances to the high beyond 40%, selling pressure on recovery days. For the process this means a high RS with broken structure is not a pullback candidate, it is a distribution pattern. The invalidation would be a reclaim of the 20-day line on above-average volume and a first higher base above it.
Dossier: biotech leads the stocks, not the group ranking
In this week's leader grid, RS at least 90, at most 15% below the high, at least 20% three-month momentum, at least a 3% daily range and $15 million in daily dollar volume, 128 stocks qualify (132 as of the Friday close), and the density at the top is unambiguous: nine of the first twenty spots belong to biotechnology, led by Revolution Medicines exactly at its high, Liquidia half a percent below, and Crinetics consolidating sideways after last week's 149% month without giving ground. That is accumulation, not distribution.
At the same time the group ranking lists the biotech and pharma bucket only 21st. The contradiction is methodical, the bucket averages hundreds of names including weak large-cap pharma, while the leader grid isolates the top. But it is also the substantive point: this biotech strength is a strength of individual names with their own catalysts, not sector beta. Trading it means trading single-stock structures with event risk, Crinetics reports as soon as August 11. The checkpoints stay the same, the ranks of the leading names and the question whether new bases form instead of the old ones stretching.
Dossier: the SpaceX test, an unlock without a crash
SpaceX delivered this week's textbook case of supply versus expectation. On Wednesday the stock lost roughly 14% ahead of its first major lockup expiration and closed at $108.27, an all-time low and the second-worst day of its short exchange history. On Thursday 911.5 million restricted shares became tradable, more than doubling the public float from about 639 million to roughly 1.55 billion shares, and instead of the feared supply shock the stock rose 5.8% to $114.92, the most liquid name of the whole cluster at nearly $24 billion in daily dollar volume. Whoever wanted to sell had done it beforehand, and Friday followed through with another 16.7% to $133.11, more than 23% in two days. Musk's stake stays locked until June 2027, further tranches follow on a staggered schedule.
The cluster celebrated along: Redwire +10.4%, BlackSky +10.4%, Intuitive Machines +8.1%, Kratos +4.1%, with 31 of 49 liquid aerospace and defense names closing higher at a median of +1.2%. The structures underneath remain broken, most names in the group trade 44 to 90% below their highs with RS ratings under 50, Rocket Lab about 47% below its high at RS 69. The exception is Iridium with RS 95, 37% three-month momentum and about 17% off its high, the only cluster name within reach of the leader grid. Friday carried the cluster further, Rocket Lab +10.8% to $82.83, Redwire +15.0%, Intuitive Machines +11.0%. Two news days still do not turn a destroyed group into leadership. This skepticism becomes invalid only when names like Redwire or Rocket Lab build higher bases above the 50-day line instead of printing one-day candles.
A broad cut through 2,474 liquid stocks puts the case in context: 62% trade above the 50-day line but only 17% near their highs, and nearly a fifth sit 40% or more below the high, a market with a strong middle and heavy edges. Financial services lead the sectors with a one-month median of +7.5% and 81% above the 50-day line, healthcare follows at +6.3%, utilities bring up the rear at -2.0% with only 20% above the line, the same flight from defensives the group ranking shows. Tech deceives here. The sector median sits at +4.2%, but only 8% of tech names trade near their highs, the index strength belongs to a few.
| Symbol | RS | Day | Read | Price | From High | Momentum 3M | Dollar Volume |
|---|---|---|---|---|---|---|---|
| SPCX | 44 | +5.8% | The 911.5M-share unlock got bought, not sold; the all-time low was the day before | 114.92 | n/a (recent IPO) | n/a | $24.0B |
| IRDM | 95 | -0.1% | Only cluster name near the leader grid | 48.31 | -16.7% | +37% | $47M |
| RDW | 75 | +10.4% | Strongest sympathy day, structure far from the high | 11.83 | -55.6% | +29% | $201M |
| RKLB | 69 | +2.4% | Most liquid alternative, but deep in a broken base | 75.67 | -47.2% | -6% | $1.3B |
| BKSY | 68 | +10.4% | News bounce on thin volume | 27.79 | -47.4% | -14% | $33M |
| LUNR | 7 | +8.1% | RS 7, no setup, just movement | 14.93 | -75.1% | -58% | $139M |
- RS
- 44
- Day
- +5.8%
- Read
- The 911.5M-share unlock got bought, not sold; the all-time low was the day before
- Price
- 114.92
- From High
- n/a (recent IPO)
- Momentum 3M
- n/a
- Dollar Volume
- $24.0B
- RS
- 95
- Day
- -0.1%
- Read
- Only cluster name near the leader grid
- Price
- 48.31
- From High
- -16.7%
- Momentum 3M
- +37%
- Dollar Volume
- $47M
- RS
- 75
- Day
- +10.4%
- Read
- Strongest sympathy day, structure far from the high
- Price
- 11.83
- From High
- -55.6%
- Momentum 3M
- +29%
- Dollar Volume
- $201M
- RS
- 69
- Day
- +2.4%
- Read
- Most liquid alternative, but deep in a broken base
- Price
- 75.67
- From High
- -47.2%
- Momentum 3M
- -6%
- Dollar Volume
- $1.3B
- RS
- 68
- Day
- +10.4%
- Read
- News bounce on thin volume
- Price
- 27.79
- From High
- -47.4%
- Momentum 3M
- -14%
- Dollar Volume
- $33M
- RS
- 7
- Day
- +8.1%
- Read
- RS 7, no setup, just movement
- Price
- 14.93
- From High
- -75.1%
- Momentum 3M
- -58%
- Dollar Volume
- $139M
Follow-up check: three questions from 007, three answers
Issue 007 set three checkpoints. First, does breadth confirm the strong Thursday with a second day above 800 winners? Answer: not quite. Monday brought 573 and Tuesday 725 stocks up more than 4%, two real accumulation days below the bar, followed by two flat days at 257 against 202 and 299 against 277. The breadth pillar stood at 64 on Friday after red readings the prior week, the direction is right, and the index record close underlines it; issue 009 carries the final Friday breadth counts.
Second, does biotech leadership hold its ranks? At the single-stock level yes, nine of the top twenty spots in the leader grid, Revolution Medicines and Liquidia at their highs. The new, coarser group ranking lists the bucket 21st, and this issue's dossier resolves that apparent contradiction. Third, does DELL build the tightness? No. Thursday minus 4.7%, again 10% below the high, the base stays unfinished and the watch continues. Add the blackout tally: AMD minus 7.0% after its report, Sezzle halved in two days, both without a position, both by rule. The open item this issue hands to 009 is the jobs report with its 80,000 to 120,000 consensus.
Leader grid: 128 names, the top in view
Filter: RS rating at least 90, distance to the 52-week high at most 15%, three-month momentum at least 20%, daily range at least 3%, average daily dollar volume at least $15 million. Table data as of the Thursday close Aug 6; as of the Friday close the grid counts 132 hits.
| Symbol | RS | ADR | Note | Group | From High | Momentum 3M | Dollar Volume |
|---|---|---|---|---|---|---|---|
| RVMD | 99 | 4.1% | Fresh Friday high at 205.15, Atlas study | Biotechnology | 0.0% | +105% | $386M |
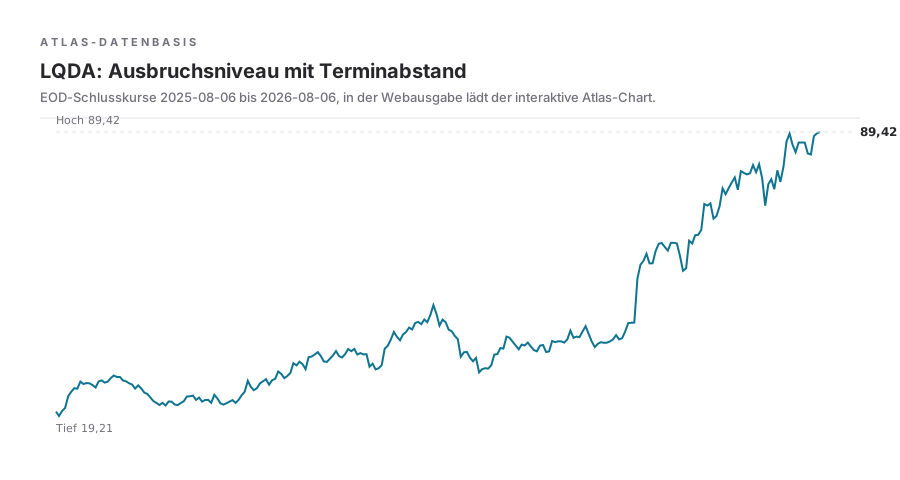
| LQDA | 99 | 6.6% | At the breakout level, Atlas study | Biotechnology | -0.4% | +143% | $83M |
| CRNX | 99 | 4.5% | Consolidating sideways, reports Aug 11, blackout window | Biotechnology | -0.2% | +109% | $241M |
| PANW | 98 | 4.8% | Most liquid software leader near the high, Atlas study | Software infrastructure | -4.5% | +96% | $2.0B |
| DELL | 99 | 7.6% | Base unfinished, on watch since 006 | Computer hardware | -10.1% | +83% | $3.1B |
| APPS | 99 | 8.2% | 43% above the 20-day line, overextended, see rejected | Application software | -2.7% | +240% | $296M |
- RS
- 99
- ADR
- 4.1%
- Note
- Fresh Friday high at 205.15, Atlas study
- Group
- Biotechnology
- From High
- 0.0%
- Momentum 3M
- +105%
- Dollar Volume
- $386M
- RS
- 99
- ADR
- 6.6%
- Note
- At the breakout level, Atlas study
- Group
- Biotechnology
- From High
- -0.4%
- Momentum 3M
- +143%
- Dollar Volume
- $83M
- RS
- 99
- ADR
- 4.5%
- Note
- Consolidating sideways, reports Aug 11, blackout window
- Group
- Biotechnology
- From High
- -0.2%
- Momentum 3M
- +109%
- Dollar Volume
- $241M
- RS
- 98
- ADR
- 4.8%
- Note
- Most liquid software leader near the high, Atlas study
- Group
- Software infrastructure
- From High
- -4.5%
- Momentum 3M
- +96%
- Dollar Volume
- $2.0B
- RS
- 99
- ADR
- 7.6%
- Note
- Base unfinished, on watch since 006
- Group
- Computer hardware
- From High
- -10.1%
- Momentum 3M
- +83%
- Dollar Volume
- $3.1B
- RS
- 99
- ADR
- 8.2%
- Note
- 43% above the 20-day line, overextended, see rejected
- Group
- Application software
- From High
- -2.7%
- Momentum 3M
- +240%
- Dollar Volume
- $296M
Biotechnology. Treppe aus Basen, Schluss exakt am 52-Wochen-Hoch. RS 99
105% Drei-Monats-Momentum, 386 Mio USD Tagesumsatz, die beste Kombination aus Struktur und Liquidität der Biotech-Führung.
Biotechnology. Enge Zone unter 90, Arbeit an der Oberkante. RS 99
143% Drei-Monats-Momentum, RS 99, kein Termin im unmittelbaren Fenster laut Scanner-Kalender.
Software - Infrastructure. Flache Basis unter dem Hoch, Serie höherer Basen. RS 98
2 Mrd USD Tagesumsatz, 96% Drei-Monats-Momentum, der liquideste Ausdruck der Software-Stärke ohne Terminrisiko.
Atlas study RVMD: the staircase closes at the high
Revolution Medicines ended the week with a 3.7% Friday gain at $205.15, a fresh 52-week high, with RS 99, 105% three-month momentum and $386 million in average daily dollar volume. Since May the chart has printed a staircase of breakout, flat consolidation and next step, most recently a four-week zone between roughly 170 and 200 that the stock left to the upside on Friday. After that push it sits roughly 18% above the 20-day line, clearly extended, and the 4.1% daily range only partly softens that. Thesis: as long as the new step holds above the zone top around 200, this is accumulation in leadership quality, and the first pullback into that level belongs to the pattern. The structure becomes invalid on a daily close back inside the zone on elevated volume. No chasing into the stretch.
Atlas study LQDA: at the breakout level, with distance to any event
Liquidia closed at $89.42, 0.4% below its 52-week high, with RS 99 and 143% momentum over three months. The chart shows a multi-month advance that has narrowed since July into a tighter zone under 90, and the stock is working the upper edge of it. With 13.7% distance to the 20-day line there is stretch in this chart too, and the 6.6% daily range demands smaller position sizes in the process. Thesis: a daily close above the 90 zone on volume would extend the leadership, before that it is a watch at the level. The picture becomes invalid on a drop back below the zone floor around 80 with follow-through selling. No report sits in the immediate window per the scanner calendar, which is what separates this name from Crinetics this week.
Atlas study PANW: the liquid anchor of software strength
Palo Alto Networks ended Thursday at $359.49, 4.5% below its 52-week high, with RS 98, 96% three-month momentum and $2 billion in daily dollar volume. Since spring the chart has built a series of higher bases, the latest one flat under the high, and the stock trades 6.3% above the 20-day line, inside its normal working distance. Of the three studies in this issue this is the least spectacular structure and the most liquid one. Whoever wants to trade the software strength of the Palantir week without biotech volatility or event risk finds the cleanest expression here. Thesis: continuation as long as the flat base under the high holds. Invalid on a daily close below the 20-day line with elevated volume, which would be the first structural break in weeks.
Tight ranges: candidates for the base list
Names from the leader grid trading close to the high and the 20-day line at the same time, the raw list for bases that can produce the next breakouts.
| Symbol | RS | ADR | Read | From High | To 20D Line | Dollar Volume |
|---|---|---|---|---|---|---|
| DNTH | 99 | 5.9% | Biotech with the tightest combination of high proximity and line proximity | -5.2% | +4.2% | $126M |
| GH | 98 | 5.3% | Diagnostics, Friday +7.5% to 168.48 straight out of the flat base | -8.3% | +4.5% | $378M |
| PANW | 98 | 4.8% | The most liquid tight structure on the list, Atlas study | -4.5% | +6.3% | $2.0B |
| ATEX | 99 | 7.6% | Right at the line, but the thinnest volume on the list | -11.2% | +1.1% | $47M |
- RS
- 99
- ADR
- 5.9%
- Read
- Biotech with the tightest combination of high proximity and line proximity
- From High
- -5.2%
- To 20D Line
- +4.2%
- Dollar Volume
- $126M
- RS
- 98
- ADR
- 5.3%
- Read
- Diagnostics, Friday +7.5% to 168.48 straight out of the flat base
- From High
- -8.3%
- To 20D Line
- +4.5%
- Dollar Volume
- $378M
- RS
- 98
- ADR
- 4.8%
- Read
- The most liquid tight structure on the list, Atlas study
- From High
- -4.5%
- To 20D Line
- +6.3%
- Dollar Volume
- $2.0B
- RS
- 99
- ADR
- 7.6%
- Read
- Right at the line, but the thinnest volume on the list
- From High
- -11.2%
- To 20D Line
- +1.1%
- Dollar Volume
- $47M
Rejected candidates: strong, but not tradable
Four names that stood out in this week's scans and still do not belong on a buy list. The reason sits next to each one, the lesson beside it, because a rejected candidate with a written reason is worth more than a tenth shallow hit.
| Symbol | Lesson | Reason |
|---|---|---|
| SITM | An EP starts a watch, it is not a finished setup | The episodic pivot of the week, +27.5% on Thursday and another +5.8% on Friday to $725.28, but at roughly 20% below the high and with negative three-month momentum it still breaks the grid. |
| APPS | Overextension waits for the first tight flag | 240% three-month momentum and 43% above the 20-day line, you do not buy the third extended candle, the same lesson CRNX taught in 007. |
| SEZL | The calendar beats the chart, for the third issue in a row | RS 98 and 156% momentum into the print, then halved in two days at -26.7% and -33.4%. The name was on no buy list because of the date. |
| WDC | High RS with broken structure is distribution, not a pullback | RS 98 from the past, but 43% below the high and 13% below the 20-day line after Thursday's 12% drop. |
- Lesson
- An EP starts a watch, it is not a finished setup
- Reason
- The episodic pivot of the week, +27.5% on Thursday and another +5.8% on Friday to $725.28, but at roughly 20% below the high and with negative three-month momentum it still breaks the grid.
- Lesson
- Overextension waits for the first tight flag
- Reason
- 240% three-month momentum and 43% above the 20-day line, you do not buy the third extended candle, the same lesson CRNX taught in 007.
- Lesson
- The calendar beats the chart, for the third issue in a row
- Reason
- RS 98 and 156% momentum into the print, then halved in two days at -26.7% and -33.4%. The name was on no buy list because of the date.
- Lesson
- High RS with broken structure is distribution, not a pullback
- Reason
- RS 98 from the past, but 43% below the high and 13% below the 20-day line after Thursday's 12% drop.
EP der Woche mit +27,5% nach verdoppeltem Umsatz, aber 24% unter dem Hoch und negatives Drei-Monats-Momentum reißen das Raster.
Ein EP ist ein Startpunkt für eine Beobachtung, kein fertiges Setup.
240% Drei-Monats-Momentum und 43% über der 20-Tage-Linie: die dritte gestreckte Kerze kauft man nicht.
Überdehnung wartet auf die erste enge Flagge.
Beat und erhöhte Guidance, trotzdem -26,7% am Donnerstag. Stand wegen des Termins auf keiner Kaufliste.
Der Kalender schlägt den Chart, zum dritten Mal in drei Ausgaben.
RS 98 aus der Vergangenheit, aber 43% unter dem Hoch und 13% unter der 20-Tage-Linie nach -12% am Donnerstag.
Hoher RS mit gebrochener Struktur ist Distribution, kein Pullback.
Macro frame: oil down, yields down, Friday open
The week's relief came from the commodity side. The partial reopening of the Strait of Hormuz pressured oil prices and took some heat out of the inflation debate, with the US 10-year yield around 4.6% on Thursday, roughly 10 basis points below the prior week. Thursday itself ran against that trend, firmer oil and rising yields pushed the Dow down 464 points, a reminder of how tightly the equity regime hangs on this axis.
On the labor side the picture is cooling. ADP reported just 44,000 new private-sector jobs for July, the smallest gain since January and well below the 75,000 consensus. The official report on Friday carries a consensus between 80,000 and 120,000 after 57,000 in June. After last week's triple dissent at the Fed in favor of a hike, the spread of possible readings is unusually wide, a weak number feeds the cooling thesis, a strong one feeds the rate-hike debate. Both are possible, and neither is worth a position before the number is on the table.
Methodology and data status
The data status of this issue is the Thursday close of Aug 6, 2026, with the signal snapshot from 04:39 UTC and the scanner scan from 04:44 UTC on Aug 7. The Friday jobs report has been amended with the official figure and the first market reaction through 10:19 ET, sourced from the BLS release and the internal signal snapshot. The Friday close was not available at press time; closing levels and the weekly tally run as the follow-up check in issue 009. The group ranking works with a reworked, coarser cut of 44 buckets since this week; prior-week ranks come from the archived snapshot of the same engine and are consistent within it, but not identical to the finer industry cut used in issue 007. The apparent contradiction between biotech's 21st group rank and its density in the leader grid is resolved in this issue's dossier. A reliably sourced VIX weekly close was not available to this desk and is named as a gap; the signal's internal volatility pillar stands at 85. Weekly figures for the Russell 2000, the dollar index, WTI, gold and bitcoin are not sourced in this issue and are therefore omitted.
Workflow: event list before buy list
Three issues, three receipts for the same order of operations: AMD minus 7.0% after a good report, Sezzle halved in two days after a beat with raised guidance, and Alphabet and Tesla in 006 before that. The practical sequence for weekly preparation stays unchanged and only grows more important the better the charts look. First, the watchlist's earnings dates go into the calendar, and every name with a report inside the holding period moves into the blackout window. Only then comes the structure work in Atlas, bases, pivotal points, alerts on levels instead of positions out of impatience. Whoever flips that order builds conviction in a chart and then negotiates with their own calendar. Crinetics on Aug 11 is the next test of this list.
Outlook: the report, then the confirmation
The week is closed, and it ended bigger than it looked for four days: minus 23,000 jobs in the report, falling yields, a record close for the S&P 500 and a signal standing at 77 green after the bell. The signal held overnight into Saturday, the only open item is the final Friday breadth recompute, and Thursday's revision showed that this reservation is not a formality.
The checkpoints for the coming week: does the recompute confirm the green, and does the value hold a close above 70 with breadth above 60? Do Revolution Medicines and Liquidia hold their highs while Crinetics reports on Tuesday and stays in the blackout window until then? And does the rate debate turn from hike to cut after the first payroll decline in months? Sourced consensus figures for the coming data week were not available at press time and will be carried in issue 009. The process remains the one from 007. The signal decides the size, the structure decides the entry, and the calendar decides the when.