The Week: Capex With Applause
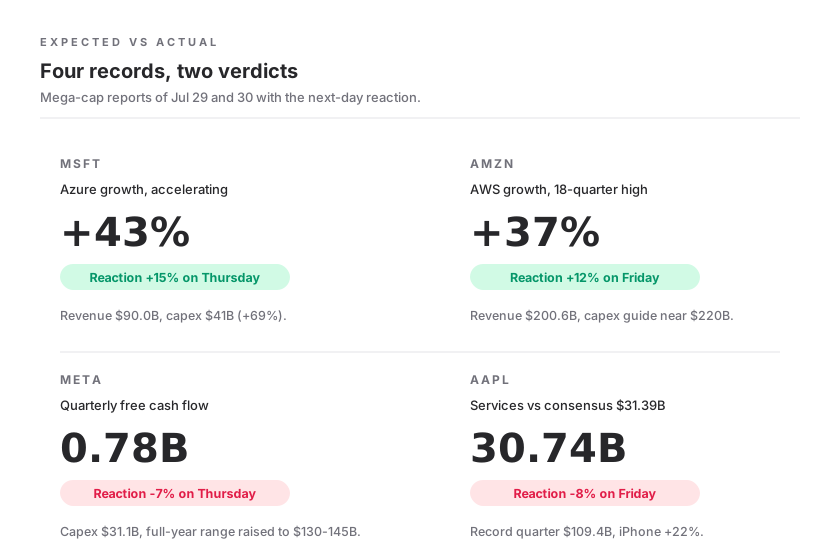
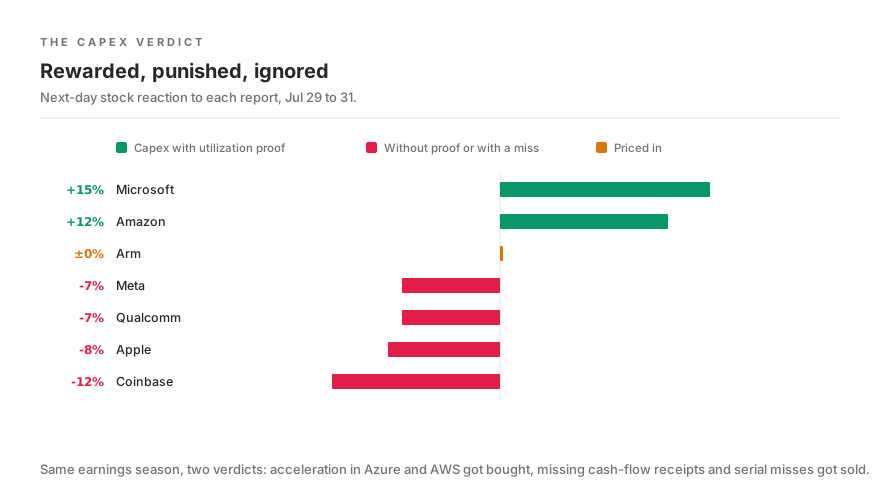
A week ago this page noted that Alphabet and Tesla were sold on record numbers because the spending side crushed the story. This week the market answered the same question the other way around. Microsoft reported 90.0 billion dollars in revenue, Azure growth accelerating to 43%, and quarterly capex of 41 billion dollars, up 69% year over year. The stock gained about 15% on Thursday, the largest one-day value gain any stock has ever recorded. Amazon lifted its 2026 investment guide toward 220 billion dollars and was paid with a 12% jump, because AWS grew 37%, its fastest rate in 18 quarters. Capex is not the problem. Capex without proof of utilization is the problem. Meta failed to deliver that proof: 31.1 billion dollars of quarterly investment left 784 million dollars of free cash flow, and the stock lost about 7%. Apple delivered a record June quarter and fell 8% on Friday because guidance and Services growth no longer carry a record valuation.
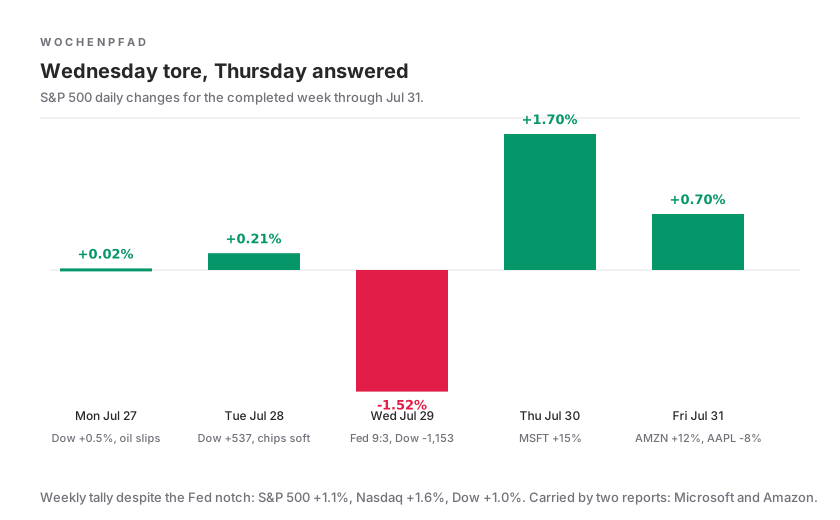
In the middle of the week sat a Fed Wednesday that almost buried the sorting. The FOMC held rates at 3.50 to 3.75%, but three members voted for a hike, the first same-direction triple dissent since September 2016. The Dow lost 1,153 points, its worst day since April 2025, and the Nasdaq briefly traded more than 10% below its all-time high. That the week still closed green, S&P 500 +1.1%, Nasdaq +1.6%, Dow +1.0%, came down to exactly two reports: Microsoft on Thursday and Amazon on Friday.
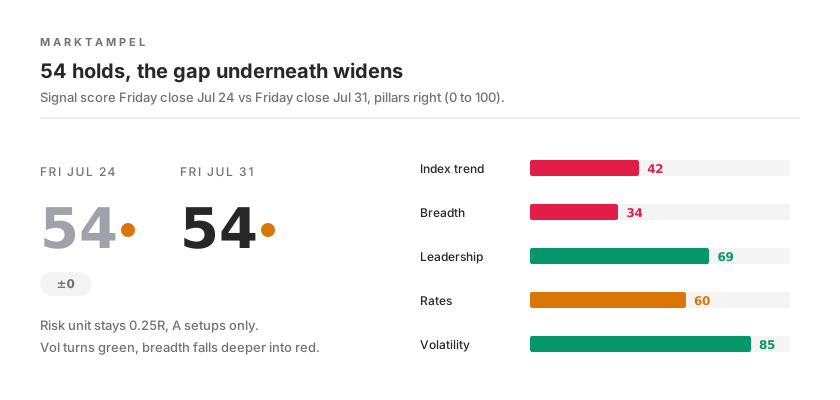
The market signal closes the week unchanged at 54 and stays yellow. Underneath, tension increased: breadth fell from 38 to 34, only 45.7% of stocks hold their 50-day line, and Friday printed 186 fresh 52-week lows against 313 highs despite an index gain. Thursday was the strongest accumulation day in weeks with 1,087 stocks up more than 4%; the Wednesday before it was one of the heaviest distribution days with 1,011 decliners. A market that capitulates one day and buys the next is not a trend, it is an argument. The risk unit stays at 0.25R, and cash counts as a position.
From the Desk: The Calendar Decided, Not Me
A week ago AMD and DELL sat on top of my watchlist, and I wrote that it was not the stocks keeping me out but the calendar: first the Fed, then the four reports. The calendar delivered. AMD broke below its 20-day line during the reporting week and now sits 16% below its high, almost 8% under the 20-day line, still at RS 97. The alerts on structure never fired, no position was ever opened, and that was the entire point of the exercise. AMD reports its own numbers on Tuesday; until then the name is a chart, not a trade.
DELL behaved differently. It holds RS 99, came back from 5.4% above the 20-day line to 2.3% below it, and sits about 13% under its high. That is not broken structure, that is the consolidation I was waiting for in issue 006. It is not finished. A base needs time and a tightness you can read in the chart, not in your wishes.
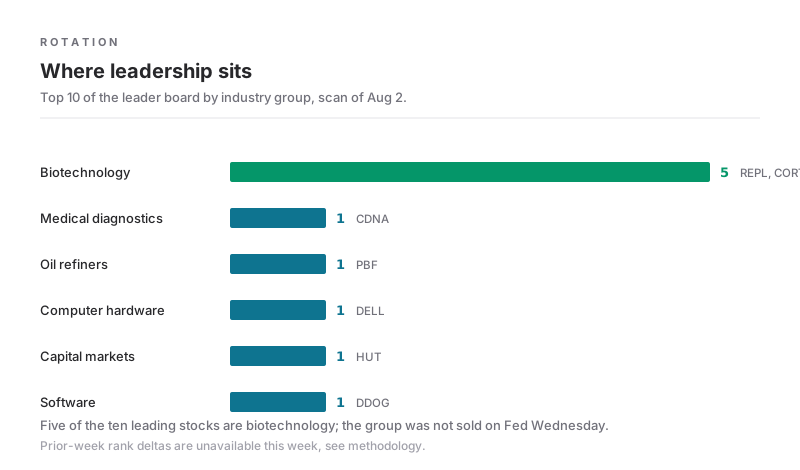
New on the sheet is the corner of the market that got bought against the Fed Wednesday: biotechnology holds five of the top ten spots on the leader board, with diagnostics right next to it in CDNA, led by CRNX with 149% one-month momentum right at its high. I do not buy verticals like that, but CORT at RS 99, 39% one-month momentum and less than 4% from its high is a candidate for the first tight base. Next to it, the refiners confirm their story from 006: PBF sits practically at its high after 83% one-month momentum, carried by Brent above 87 dollars and an oil month up more than 20%.
The week's lesson is uncomfortable, which is why it matters: whoever sold into Wednesday's Fed shock missed the strongest buying day in weeks on Thursday. Whoever was fully invested beforehand had to sit through Wednesday. Both point to the same answer for trading this phase: small risk unit, alerts on structure instead of positions out of impatience, and earnings dates as a hard no-trade zone.
| Symbol | RS | Note | From High | Momentum 3M | To 20D Line | Dollar Volume |
|---|---|---|---|---|---|---|
| AMD | 97 | Below the 20-day line, earnings Tue Aug 5, no-trade zone | -16.3% | +41% | -7.9% | 14.5B |
| DELL | 99 | Consolidating toward a base, not tight enough yet | -12.9% | +89% | -2.3% | 3.8B |
| CORT | 99 | New candidate, far above the 20-day line, waiting for the first tight base | -3.8% | +155% | +27.5% | 0.13B |
- RS
- 97
- Note
- Below the 20-day line, earnings Tue Aug 5, no-trade zone
- From High
- -16.3%
- Momentum 3M
- +41%
- To 20D Line
- -7.9%
- Dollar Volume
- 14.5B
- RS
- 99
- Note
- Consolidating toward a base, not tight enough yet
- From High
- -12.9%
- Momentum 3M
- +89%
- To 20D Line
- -2.3%
- Dollar Volume
- 3.8B
- RS
- 99
- Note
- New candidate, far above the 20-day line, waiting for the first tight base
- From High
- -3.8%
- Momentum 3M
- +155%
- To 20D Line
- +27.5%
- Dollar Volume
- 0.13B
Market Signal: 54 Holds, the Gap Underneath Widens
The market signal closes the week at 54 of 100, exactly where it closed the prior Friday. Yellow stays yellow, the risk unit stays 0.25R, A-setups with traction only. Beneath the unchanged number, the composition shifted in both directions at once. The volatility pillar turned green at 85: the options market does not price the Fed shock as the start of something bigger. Leadership holds at 69 and remains the load-bearing pillar: biotechnology, refiners and the data-center supply chain provide the leadership, and Thursday showed that this money is real.
Against that stand two red pillars that got redder. The index trend sits at 42, none of the three core indexes holds a bullish short-term trend despite the weekly gain. Breadth fell from 38 to 34: only 40.8% of stocks are advancing, only 45.7% hold the 50-day line, and Friday's 186 fresh lows are an unusually high number for an up week. The rates pillar sits at 60 after the hawkish hold, the inflation pillar at 74, because core PCE at 3.3% is falling but far above target.
To the downside, the yellow becomes invalid if leadership drops below 60 or the leading groups give up their ranks. To the upside it takes a reclaim of the 50-day line in QQQ and the S&P 500, and breadth that confirms an accumulation day like Thursday instead of selling it the next session.
Index Picture: A Week Shaped Like a Notched V
Monday and Tuesday ran quiet and split: the Dow gained a combined 800 points on earnings outside technology, while the Nasdaq slipped 0.18% and 0.22% and semiconductors gave up capital. Oil fell on hopes of an Iran ceasefire, which briefly eased rate pressure.
Wednesday was the break. After a rate decision with three dissents toward a hike, the S&P 500 and Nasdaq briefly turned positive during the press conference and then slid into the close: S&P 500 -1.52% to 7,316.15, Nasdaq -1.74% to 24,442.94 and at times more than 10% below its all-time high, Dow -1,153 points to 51,594.14, its worst day since April 2025. The bond market read the decision as an admission that the Fed is running behind inflation.
Thursday answered Wednesday with the Microsoft report: Nasdaq +2.8% to 25,122.18, S&P 500 +1.7% to 7,437.64, Dow +614 points. It was the strongest accumulation day in weeks, with 1,087 stocks up more than 4%. Friday followed through with Amazon, +12% in the single stock, +1.0% in the Nasdaq to 25,373.85, S&P 500 +0.7% to 7,489.72, while Apple lost 8%. The weekly tally: S&P 500 +1.1%, Nasdaq +1.6%, Dow +1.0%. July ended mixed; the Nasdaq lost 3.2% on the month while the Dow, per CNBC, logged its fourth winning month in a row.
Weekly Calendar: What Was Scheduled and What Came of It
The event density was the highest of the summer: a Fed decision, four mega-cap reports, GDP, PCE and consumer confidence in five sessions. The table lists each event with expectation, outcome and market reaction.
What Changed The Weekly Plan
FOMC rate decision
Consumer confidence (Conference Board)
GDP Q2 (advance)
PCE inflation June
Microsoft, Meta
Apple, Amazon
Earnings of the Week: Two Winners, Two Losers, One Pattern
Four mega caps, four record quarters, two completely different market verdicts. The dividing line was not the size of the investment but the proof that it already pays off in accelerating growth. Azure and AWS delivered that proof; Meta and Apple did not.
What Changed The Weekly Plan
Microsoft Q4: revenue 90.0B (+18%), EPS 4.74
Meta Q2: revenue 60.8B (+28%), EPS 6.18 below consensus 7.22
Apple Q3: revenue 109.4B (+16%), EPS 2.02
Amazon Q2: revenue 200.6B (+20%)
Qualcomm: mixed quarter, weak profit outlook
Arm: above expectations, data-center royalties more than doubled
Coinbase Q2: revenue 1.22B below consensus, net loss 359.5M
Amazon GAAP profit includes a 53.4B pre-tax one-off from the Anthropic stake
Season Scorecard: The Capex Verdict Is In
Two weeks of mega-cap reports are enough to name the season's pattern. The market rewards investment exactly when the cloud or infrastructure business accelerates in the same report. It punishes investment when free cash flow disappears without the growth curve answering.
| Read | Pattern | Evidence |
|---|---|---|
| The market funds utilization, not hope | Capex plus acceleration gets bought | Microsoft +15% on Azure 43%, Amazon +12% on AWS 37% |
| Same math, second week running | Capex without a cash-flow receipt gets sold | Meta -7% on 784M free cash flow, Alphabet -7% and Tesla -14% the prior week |
| Valuation is drop height, not cushion | A record is not enough at a record valuation | Apple -8% despite its best June quarter ever |
| Reaction beats result, still the core rule | Priced-in strength moves nothing | Arm above expectations, stock unchanged |
| Operating numbers beat GAAP optics | The market separates one-offs cleanly | Amazon's 53.4B Anthropic book gain had no own price effect |
- The market funds utilization, not hope
- Pattern
- Capex plus acceleration gets bought
- Evidence
- Microsoft +15% on Azure 43%, Amazon +12% on AWS 37%
- Same math, second week running
- Pattern
- Capex without a cash-flow receipt gets sold
- Evidence
- Meta -7% on 784M free cash flow, Alphabet -7% and Tesla -14% the prior week
- Valuation is drop height, not cushion
- Pattern
- A record is not enough at a record valuation
- Evidence
- Apple -8% despite its best June quarter ever
- Reaction beats result, still the core rule
- Pattern
- Priced-in strength moves nothing
- Evidence
- Arm above expectations, stock unchanged
- Operating numbers beat GAAP optics
- Pattern
- The market separates one-offs cleanly
- Evidence
- Amazon's 53.4B Anthropic book gain had no own price effect
Macro: A Hawkish Hold Meets a Softening Economy
The macro week fits in one sentence: the economy is cooling, inflation is falling too slowly, and the Fed kept the door to a hike open. GDP +1.5% after +2.1%, core PCE at 3.3%, one tenth below May but far above target, consumer confidence down for a third straight month. The dollar lost more than 1% on the week despite the hawkish Fed, and the ten-year yield closed near 4.65%.
What Changed The Weekly Plan
Rate decision with a triple dissent toward a hike (Logan, Hammack, Kashkari)
GDP Q2, advance estimate
PCE June: headline 3.7% after 4.1%, core 3.3% after 3.4%
Consumer confidence 90.8, expectations component 74.7
Dollar index falls to 99.78, three down days, suspected yen intervention
Breadth: One Buying Day Does Not Prove a Turn
This week's breadth record has a gap, and it deserves naming: no daily readings exist for Monday and Tuesday because the internal measurement service was down on those days. From Wednesday on, the picture is complete, and it is the sharpest contrast program in months. Fed Wednesday brought 275 gainers above 4% against 1,011 decliners, one of the heaviest distribution days of the year. Thursday answered with 1,087 gainers against 397 decliners, the strongest accumulation day in weeks. Friday fell back to 434 against 727, and that with rising indexes.
The state underneath remains damaged. Only 40.8% of stocks are advancing, 45.7% hold the 50-day line, down from 47.1% at the prior week's close. The most striking single number of the week: 186 fresh 52-week lows on Friday against 313 new highs. An up week for the indexes with almost 200 fresh lows on the final day means the recovery is carried by a few heavyweight names while the broad market keeps leaking. For practice: Thursday only counts once breadth confirms it in the new week, with a second day above 800 gainers and the 50-day ratio back above 50%.
Rotation: Where Money Moved Under the Surface
This issue's rotation math comes with a caveat: because of the internal service outage, prior-week ranks are missing and a clean rank delta per group cannot be shown this week. What the leader board and group standings still show with confidence: biotechnology is where leadership formed this week. Five of the top ten leader-board spots are biotech names; counting diagnostics next to them, six come from the medical complex, from CRNX through RVMD to CORT, all at RS 99 and all within 4% of their highs. The group was not sold on Fed Wednesday, and that is the relevant information.
Second, the energy story from issue 006 holds. Brent finished July up more than 20% on the month, and the refiners confirm with PBF practically at its high. Third, the data-center supply chain is regrouping: not the chip designers lead now but distributors and integrators like Insight and Arrow; Technology Distributors sit on top of the group standings. That fits the earnings capex pattern: when Microsoft and Amazon together deploy well over 250 billion dollars a year, the supply chain earns first.
Group Standings: The Current State in Numbers
The table shows the leading industry groups. Median RS and one-month momentum are computed per group across all members of the Aug 2 full scan (median). A prior-week rank delta cannot be shown because of the snapshot gap, see the rotation section; the ranks follow the read from group standings and the leader board.
| Group | Rank | Status | Median RS | Momentum 1M |
|---|---|---|---|---|
| Technology Distributors | 1 | Strongest group score in the grid, Insight and Arrow lead the data-center supply chain | 89 | +7.7% |
| Biotechnology | 2 | Eleven liquid names at RS 97+, holds five of the top ten leaders; strength sits at the top of a broad group | 57 | +0.5% |
| Oil & Gas Refining | 3 | Highest median RS in the field, PBF at its high, Brent month above +20% | 92 | +20.5% |
| Exchanges and market data | 4 | CBOE, Nasdaq, FactSet: volatility is their revenue | 52 | +17.2% |
| Discount stores | 5 | Defensive consumer holds up, consistent with falling confidence | 60 | +6.6% |
- Technology Distributors
- Rank
- 1
- Status
- Strongest group score in the grid, Insight and Arrow lead the data-center supply chain
- Median RS
- 89
- Momentum 1M
- +7.7%
- Biotechnology
- Rank
- 2
- Status
- Eleven liquid names at RS 97+, holds five of the top ten leaders; strength sits at the top of a broad group
- Median RS
- 57
- Momentum 1M
- +0.5%
- Oil & Gas Refining
- Rank
- 3
- Status
- Highest median RS in the field, PBF at its high, Brent month above +20%
- Median RS
- 92
- Momentum 1M
- +20.5%
- Exchanges and market data
- Rank
- 4
- Status
- CBOE, Nasdaq, FactSet: volatility is their revenue
- Median RS
- 52
- Momentum 1M
- +17.2%
- Discount stores
- Rank
- 5
- Status
- Defensive consumer holds up, consistent with falling confidence
- Median RS
- 60
- Momentum 1M
- +6.6%
Technology Distributors
Empfängerseite des Capex-Zyklus, Spitze der Gruppenwertung nach Stärke-Score.
Theme: The Capex Bill, Round Two
Issue 006 ended on the question of whether mega-cap investment plans still read as strength or already as cost risk. This week's answer is more precise than expected: both, along one clear criterion. Microsoft invests 41 billion dollars a quarter, 69% more than a year ago, and gets celebrated because Azure simultaneously accelerates from 39 to 43% growth with guidance at 45%. Amazon lifts its annual guide toward 220 billion and gets celebrated because AWS shows its fastest growth in 18 quarters. Meta raises its capex range too, to 130-145 billion, and gets sold because 784 million dollars of free cash flow remain and advertising cannot close that gap.
That formulates the rule for the coming quarters: the market funds the buildout as long as utilization shows up in the same report. This is not a bubble-or-not debate, it is a cash-flow calculation per stock. For the watchlist it means the receiving side stays more attractive than the paying side: whoever collects Amazon's 220 billion and Microsoft's 41 billion a quarter, from distributors through networking to power, has the tailwind without carrying the spending load.
Theme: Paper Gains in the AI Chain
Amazon's quarter contained a number bigger than its operating income: a 53.4 billion dollar pre-tax one-off from revaluing its Anthropic stake, 62.6 billion net. The market treated that number correctly, namely by ignoring it, and bought the stock for AWS. But the magnitude deserves its own paragraph, because it shows how much valuation now circulates among the AI companies themselves. Stake gains of this kind are book entries: they raise no cash, they fill no data centers, and they can vanish in a weak quarter with the same stroke of a pen.
The table sorts the classes of AI revenue by resilience. It continues the balance-sheet discipline from issue 006: not every AI number in an income statement is revenue, and not all revenue is recurring.
| Read | Risk | Class | Examples |
|---|---|---|---|
| The currency the market paid for this week | Capacity limits, pricing pressure from 2027 | Usage revenue with acceleration | Azure +43%, AWS +37% |
| Solid, but no surprise premium | Already priced in | License and royalty streams | Arm data-center royalties doubled |
| Sold until the receipt arrives | Confidence withdrawal like Thursday | Capex promises without a cash-flow receipt | Meta 130-145B guide on 784M free cash flow |
| Strike from the operating tally | Reversible, no cash | Stake book gains | Amazon 53.4B from Anthropic |
- The currency the market paid for this week
- Risk
- Capacity limits, pricing pressure from 2027
- Class
- Usage revenue with acceleration
- Examples
- Azure +43%, AWS +37%
- Solid, but no surprise premium
- Risk
- Already priced in
- Class
- License and royalty streams
- Examples
- Arm data-center royalties doubled
- Sold until the receipt arrives
- Risk
- Confidence withdrawal like Thursday
- Class
- Capex promises without a cash-flow receipt
- Examples
- Meta 130-145B guide on 784M free cash flow
- Strike from the operating tally
- Risk
- Reversible, no cash
- Class
- Stake book gains
- Examples
- Amazon 53.4B from Anthropic
Theme: Oil Between Ceasefire and Escalation
The oil story ran both directions this week and still ended firmer. Early in the week, hopes for an Iran ceasefire pushed prices well below the prior week's levels, when Brent had tested 100 dollars for the first time since May. On Friday the picture turned: renewed tension between the US and Iran, tankers turning around in the Strait of Hormuz, and Brent closed at 87.84 dollars, finishing July up more than 20% on the month.
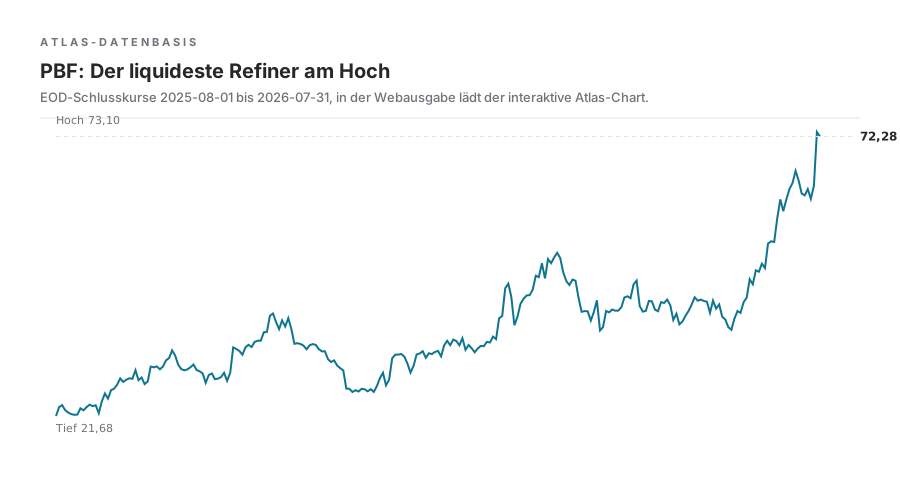
For equities, the structure matters more than the daily print: headline inflation fell in June precisely because energy got cheaper during the ceasefire phase. An oil month of +20% works with a lag against exactly that relief, and with it against the Fed's room to maneuver. Meanwhile the refiners remain the cleanest equity expression of the theme: they earn the spread, not the price, and PBF sits practically at its high after 83% one-month momentum. The group has carried for two issues now, and as long as crack spreads hold, it belongs on the watchlist, not in the archive.
Follow-Up: What Became of Issue 006's Claims
Issue 006 committed itself in four places, and all four can be measured. First: AMD and DELL as top candidates, but no buying before the Fed and earnings. Result: AMD broke the 20-day line and sits 16% below its high, DELL consolidated to 13% below its high. No alert fired, no position was opened, and the no-trade zone prevented losses. Second: the memory rally from 006 as durable leadership. Result: mixed; semiconductors gave up capital on Monday and Tuesday, Qualcomm disappointed, only the supply chain held. Leadership migrated to biotech and refiners; the rotation picture from 006 continued, just faster than expected.
Third: the note that a Fed week with four mega-cap reports was the issue's main risk. Result: exactly what happened; Wednesday brought the worst Dow day since April 2025, Thursday the resolution. Whoever respected the no-trade zone came through both sides intact. Fourth: CRNX as a leader with a standing base. Result: 149% one-month momentum; the stock sits at its high and is now too vertical to enter, but the base analysis was correct. The honest tally: process discipline protected more money this week than any single stock pick would have earned.
Earnings Pivots: Lessons From the Reactions
Reaction beats result; that remains the core rule of every earnings season. Six cases this week, six lessons.
| Lesson | Result | Company | Reaction |
|---|---|---|---|
| Acceleration in the core business is the season's strongest currency | Revenue and EPS above consensus, Azure accelerating to 43% | Microsoft | +15%, record value gain |
| The market cleanly separates operating strength from book gains | AWS +37%, operating income +43% | Amazon | +12% to 263.07 |
| A beat on the wrong line does not save the report | Revenue beat, EPS miss, free cash flow near zero | Meta | -7% |
| Valuation is drop height: a record is not enough when Services disappoint | Record June quarter, iPhone +22% | Apple | -8% to 307.89 |
| No reaction to good numbers is itself a signal | Above expectations, royalties doubled | Arm | Unchanged |
| Serial misses get more expensive every quarter | Third revenue miss in a row, net loss | Coinbase | Down as much as 12% |
- Acceleration in the core business is the season's strongest currency
- Result
- Revenue and EPS above consensus, Azure accelerating to 43%
- Company
- Microsoft
- Reaction
- +15%, record value gain
- The market cleanly separates operating strength from book gains
- Result
- AWS +37%, operating income +43%
- Company
- Amazon
- Reaction
- +12% to 263.07
- A beat on the wrong line does not save the report
- Result
- Revenue beat, EPS miss, free cash flow near zero
- Company
- Meta
- Reaction
- -7%
- Valuation is drop height: a record is not enough when Services disappoint
- Result
- Record June quarter, iPhone +22%
- Company
- Apple
- Reaction
- -8% to 307.89
- No reaction to good numbers is itself a signal
- Result
- Above expectations, royalties doubled
- Company
- Arm
- Reaction
- Unchanged
- Serial misses get more expensive every quarter
- Result
- Third revenue miss in a row, net loss
- Company
- Coinbase
- Reaction
- Down as much as 12%
Leader Board: Cleaned Up and Re-Sorted
A housekeeping note first: the leader ranking was technically cleaned this week. Stocks whose momentum came from unadjusted reverse splits are now excluded from the ranking, and proximity to the 52-week high is set as a default filter. The list therefore shows again what it was built for: stocks leading now, not stocks that were good a year ago.
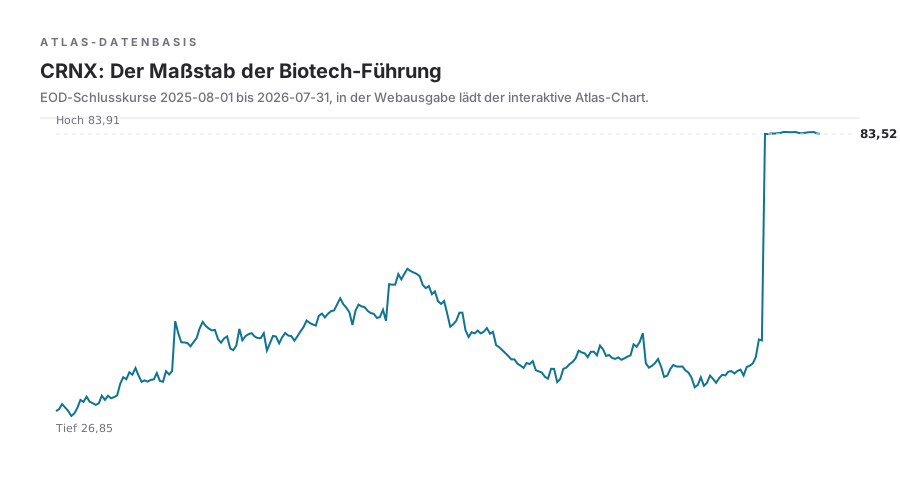
The result carries one clear message. Biotechnology dominates the top with CRNX (149% one-month momentum, at its high), CORT, RVMD, CDNA and APGE, all at RS 99 and all within 4% of their highs. Behind them, PBF confirms for the refiners and DDOG for the software side. The three charted names of this issue: CRNX as the group's yardstick, PBF as the most liquid expression of the energy theme, and RVMD as the biotech with the best combination of liquidity (573 million dollars daily volume) and proximity to the high on a chart that is not vertical.
Biotechnology. Vertikale am Hoch, Beobachtung statt Einstieg. RS 99
149% Monats-Momentum, RS 99, 258 Mio USD Dollarvolumen. Der Maßstab, an dem die Biotech-Führung hängt.
Oil & Gas Refining. Ausbruch über die Sommer-Range, am 52-Wochen-Hoch. RS 99
83% Monats-Momentum, 200 Mio USD Dollarvolumen, liquidester Ausdruck des Energie-Themas.
Biotechnology. Aufwärtstreppe an der Ausbruchsmarke, nicht vertikal. RS 99
573 Mio USD Dollarvolumen, 28% Monats-Momentum, die beste Kombination aus Liquidität und Struktur in der Gruppe.
Atlas: CRNX, the Yardstick of Biotech Leadership
Crinetics Pharmaceuticals sits practically at its 52-week high after 149% one-month momentum and leads the ranking at RS 99. The chart shows the base described in issue 006, the upside resolution out of it, and the vertical of the last four weeks. For a fresh entry the move is too extended; the 20-day line runs far below price. The stock stays in the issue anyway because it is the yardstick for the group: as long as CRNX holds its vertical and does not break the first consolidation zone on volume, biotech leadership is intact. The checkpoint is the first tight flag; only there does a tradeable structure appear again.
Atlas: PBF, the Most Liquid Refiner at Its High
PBF Energy closed the week 0.4% below its 52-week high after 83% one-month momentum, carried by an oil month up more than 20%. The chart shows the series of higher lows since spring and the breakout above the summer range that confirmed the refiner thesis from issue 006. At 200 million dollars of daily volume, it is the theme's most liquid expression. The dependency is obvious and belongs in every risk assessment: a real ceasefire in the Iran conflict removes the move's fuel, and losing the breakout zone would be the technical signal for it. Until then: pullbacks into the zone are observation points, not buy signals without a base.
Atlas: RVMD, Liquidity Meets Structure
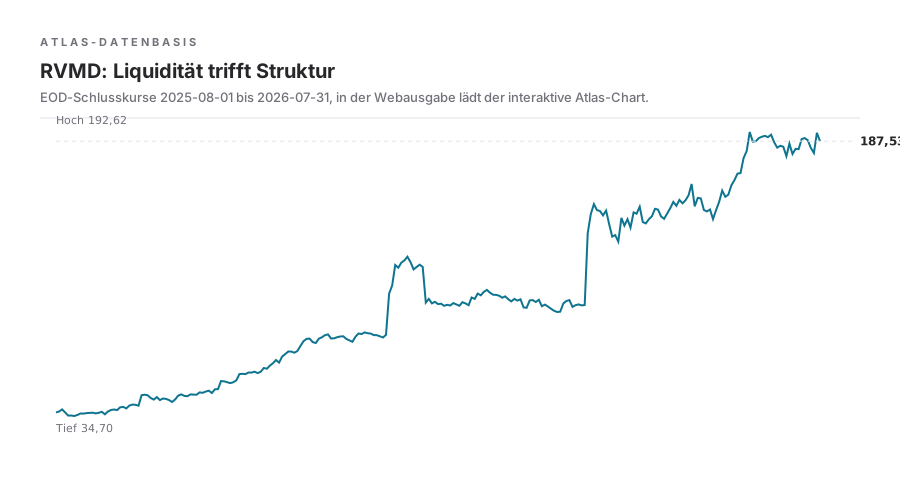
Revolution Medicines combines what rarely comes together at the top of biotech: RS 99, less than 1% from its high, 573 million dollars of daily volume, and a chart that is not vertical. With 28% one-month momentum it has the calmest slope of the leading biotech names and sits right at its breakout mark after a multi-week staircase. That is the structure tradeable setups come from: a tight consolidation above the mark would be the first base, a daily close below it on elevated volume the invalidation. Of the three charted names, RVMD is the one where observation can most plausibly turn into a plan.
Tight Ranges: Where the Next Move Is Loading
The table filters for RS 85 and above, at most 2% from the 20-day line, at most 15% from the high, and at least 100 million dollars of daily volume. These are the names that stayed tight through a Fed week, and tightness after a shock Wednesday is a statement of quality.
| Symbol | RS | Group | To 20D | From High |
|---|---|---|---|---|
| DDOG | 98 | Software (monitoring) | +1.6% | -5.9% |
| FTNT | 97 | Cybersecurity | +1.7% | -5.3% |
| ROIV | 96 | Biopharma holding | +1.7% | -8.4% |
| LGND | 95 | Biotechnology | +0.5% | -11.8% |
| OKTA | 95 | Cybersecurity | +1.3% | -13.2% |
| COGT | 95 | Biotechnology | -1.4% | -11.0% |
- RS
- 98
- Group
- Software (monitoring)
- To 20D
- +1.6%
- From High
- -5.9%
- RS
- 97
- Group
- Cybersecurity
- To 20D
- +1.7%
- From High
- -5.3%
- RS
- 96
- Group
- Biopharma holding
- To 20D
- +1.7%
- From High
- -8.4%
- RS
- 95
- Group
- Biotechnology
- To 20D
- +0.5%
- From High
- -11.8%
- RS
- 95
- Group
- Cybersecurity
- To 20D
- +1.3%
- From High
- -13.2%
- RS
- 95
- Group
- Biotechnology
- To 20D
- -1.4%
- From High
- -11.0%
Rejected: Strength That Is Not Tradeable
Three names from the top of the raw data that deliberately do not make the watchlist. CRNX after 149% in one month: too vertical; the next base can be awaited instead of buying the third extended candle. CDNA at RS 99 exactly at its high but with only 40 million dollars of daily volume: too thin; an exit into weakness would move the price itself. And AMD, as clear as the three-month strength is: below the 20-day line and two days before its own report, the name is a no-trade zone, not an opportunity. Rejecting here explicitly does not mean forgetting; it means defining the checkpoint where a no becomes a maybe again.
149% in einem Monat: als Trade zu vertikal, als Maßstab unverzichtbar. Beobachtung bis zur ersten engen Flagge.
Die dritte gestreckte Kerze kauft man nicht.
RS 99 exakt am Hoch, aber nur 40 Mio USD Dollarvolumen: ein Ausstieg in Schwäche bewegt den Kurs selbst.
Steilheit ersetzt keine Liquidität.
Unter der 20-Tage-Linie und zwei Tage vor den eigenen Zahlen: Sperrzone, keine Gelegenheit.
Der Kalender schlägt den Chart.
Macro Frame: The Fed Under Warsh Shows Its Reaction Function
This was the most informative meeting since the change at the top of the Fed, not because of the decision but because of its edges. Three members, Logan, Hammack and Kashkari, voted for a hike, the first same-direction triple dissent since September 2016. Chair Warsh commented dryly in the press conference that he had asked for a good family fight and got one, and reaffirmed that the Fed will not hesitate to stop inflation. The bond market read both as an admission that 3.3% core PCE at 1.5% growth is a dilemma without a comfortable exit: yields rose on Wednesday even though nothing was decided.
For equities this means the rates pillar stays a headwind, and the September meeting on the 15th and 16th, with fresh projections, is the next hard waypoint. Until then the data rules, starting with the jobs report next Friday. A weak report defuses the hawks; a strong one turns three dissents into a majority debate. It remains notable that the dollar lost more than 1% despite a hawkish Fed; part of the market is already trading the question of whether the Fed is behind the curve, and historically that is an environment for selective, not broad, equity strength.
Fed Scenarios Into the September Meeting
Three paths, three playbooks. The jobs report on August 7 is the first switch.
| Read | Playbook | Scenario | Market Read |
|---|---|---|---|
| Hawks lose their argument, a September hold becomes the base case | On confirmed breadth, raise the risk unit and buy leader bases | Data cools, core PCE keeps falling | Relief rally with broader participation possible |
| Status quo: yellow persists, the dissent keeps simmering | Keep 0.25R, A-setups from leading groups only | Data stays sticky, inflation sideways | Selective market like now, leadership rotates by group |
| Three dissents become a hiking debate | Cut exposure, alerts below breakout zones, defend cash | Inflation re-accelerates, the oil month feeds through | Valuation pressure on everything long-duration, the vol pillar flips |
- Hawks lose their argument, a September hold becomes the base case
- Playbook
- On confirmed breadth, raise the risk unit and buy leader bases
- Scenario
- Data cools, core PCE keeps falling
- Market Read
- Relief rally with broader participation possible
- Status quo: yellow persists, the dissent keeps simmering
- Playbook
- Keep 0.25R, A-setups from leading groups only
- Scenario
- Data stays sticky, inflation sideways
- Market Read
- Selective market like now, leadership rotates by group
- Three dissents become a hiking debate
- Playbook
- Cut exposure, alerts below breakout zones, defend cash
- Scenario
- Inflation re-accelerates, the oil month feeds through
- Market Read
- Valuation pressure on everything long-duration, the vol pillar flips
Methodology: Where the Numbers Come From
All market and stock metrics come from the WickedDesk scan of August 2, 2026 across 4,682 US stocks: RS rating as a percentile rank, momentum windows from one to twelve months, distances to the 20-day line and the 52-week high, dollar volume as an average. The market signal weighs nine pillars from index trend to seasonality into a score from 0 to 100. Index levels, earnings figures and macro data come from the primary and secondary sources linked in the source ledger; every number in this issue has an entry there. Two gaps this week are flagged in the text: the breadth measurement for Monday and Tuesday is missing, and the group standings have no prior-week ranks. Both trace back to an outage of the internal measurement service, which has since been fixed. We disclose gaps instead of filling them.
Workflow: The No-Trade Zone as a Tool
The most useful move this week was not an analysis but a rule: no entries in a watchlist candidate ahead of its earnings date, no matter how good the chart looks. In WickedDesk the date sits right next to the chart in Atlas. The routine: check the candidate, check the date, and if the report falls within the next five sessions, the name goes into the waiting loop with an alert on structure instead of into the book. AMD showed why this week: the chart was still a candidate on Monday, sat 8% below the 20-day line on Friday, and the company reports on Tuesday. Whoever respected the zone lost nothing and missed nothing, because without a base there was nothing to buy anyway.
Ahead: The Jobs Report and the Second Row
The coming week belongs to the jobs report on Friday, 8:30 New York time, the first hard date on the road to the September meeting. Before that, the second row of the AI chain reports: Palantir Monday after the close, AMD on Tuesday with the question of whether data-center demand covers handset weakness, Disney on Wednesday, Eli Lilly on Thursday with the focus on the weight-loss franchise, plus Shopify, McDonald's, Uber and Airbnb. For the process this means the no-trade-zone rule stays active; AMD is off limits until Tuesday evening. The week's checkpoints: does breadth confirm Thursday with a second day above 800 gainers? Does biotech leadership hold its ranks? And does DELL form the tightness the desk has been waiting on for two issues? The signal decides the size, the structure decides the entry, and the calendar decides the when.