
Who pays for the new data centers?
Last week was about Micron’s record quarter. This week brings the other side of that business: who pays for the computing capacity being built? New reporting on OpenAI’s revenue makes that question harder to ignore.
I would not infer the end of AI demand or a guaranteed next selloff from this report. But suppliers can deliver excellent results while their customers still need to finance substantial losses. That dependence belongs in the valuation alongside chip demand.
Oil and high interest rates also make expansion more expensive. This affects more than technology companies. In the coming earnings reports, financing, costs and cash left after investment matter as much as revenue.
Technology slips. Smaller stocks remain vulnerable.
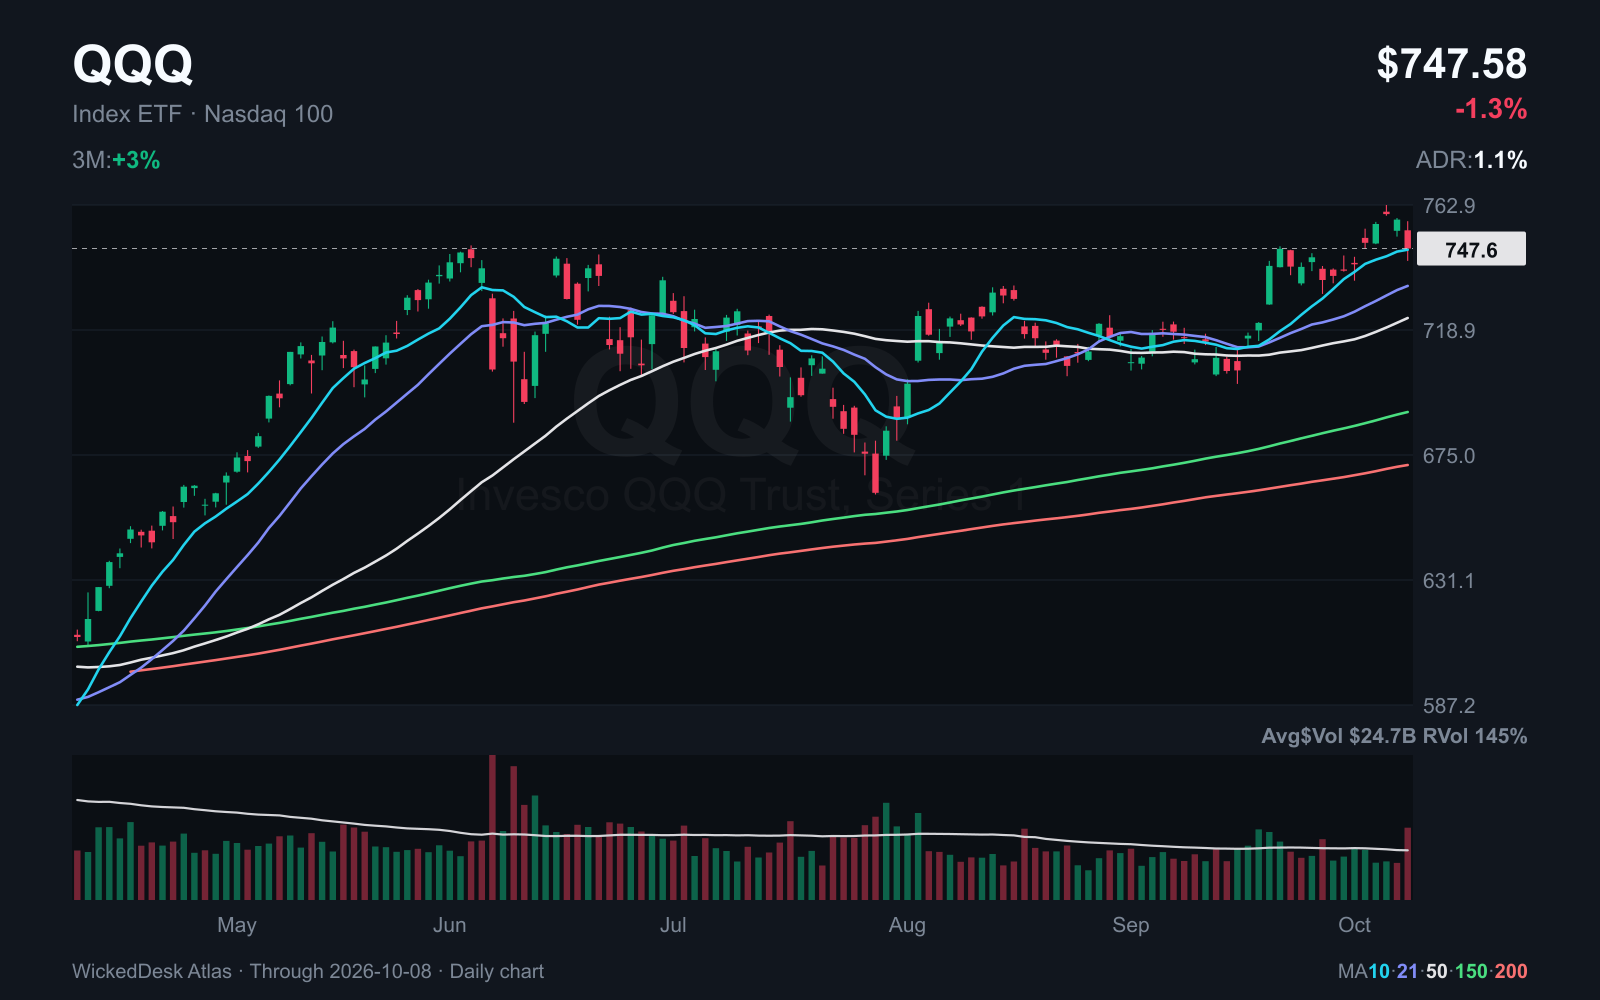
QQQ falls 1.34% on Thursday and SPY 0.42%. DIA edges higher while IWM barely changes. Across the four completed sessions, SPY is +0.6% above the previous Friday, QQQ -0.3% lower and IWM -1.4% lower.
IWM closes at $277.57, against a 200 day SMA of $276.94. That small gap leaves little room for further losses. QQQ is only slightly above its 10 day average.
All closing prices and daily charts end on Thursday, October 8. Friday’s session is not complete. Today’s news is discussed separately.
| Symbol | On Thursday | Thursday close | Since October 2 |
|---|---|---|---|
| SPY | -0.4% | 773.93 USD | +0.6% |
| QQQ | -1.3% | 747.58 USD | -0.3% |
| DIA | +0.1% | 511.65 USD | +0.1% |
| IWM | -0.05% | 277.57 USD | -1.4% |
- On Thursday
- -0.4%
- Thursday close
- 773.93 USD
- Since October 2
- +0.6%
- On Thursday
- -1.3%
- Thursday close
- 747.58 USD
- Since October 2
- -0.3%
- On Thursday
- +0.1%
- Thursday close
- 511.65 USD
- Since October 2
- +0.1%
- On Thursday
- -0.05%
- Thursday close
- 277.57 USD
- Since October 2
- -1.4%
QQQ gives back its weekly gain
QQQ closes at $747.58. Its 10 day average is $747.15 and its 50 day average $723.17. Thursday’s recovery after a lower opening is insufficient: the close also finishes below the open. Volume reaches 1.45 times the average of the preceding 50 sessions.
Next week I want to see whether buyers absorb this pullback. One higher opening would not be enough. Recovering losses with more stocks participating would be more useful evidence. The red line in the Atlas chart is the 200 day SMA.
$50 billion versus $70 billion: The basis matters
The Financial Times reports that OpenAI is approaching $50 billion in annualized revenue. The earlier $70 billion figure treated partner revenue differently. This does not establish a missed annual target. Annualized revenue projects a current sales pace over twelve months. It is not a completed year of sales.
The comparison does not mean $20 billion in actual sales disappeared. The questions for investors are how much revenue OpenAI retains, what obligations it faces and which assumptions financed the buildout.
OpenAI is not publicly listed. Its suppliers and lenders provide the equity market connection. A lower comparison figure alone proves neither an inability to pay nor disappearing AI demand.
Thursday’s close confirms the selling
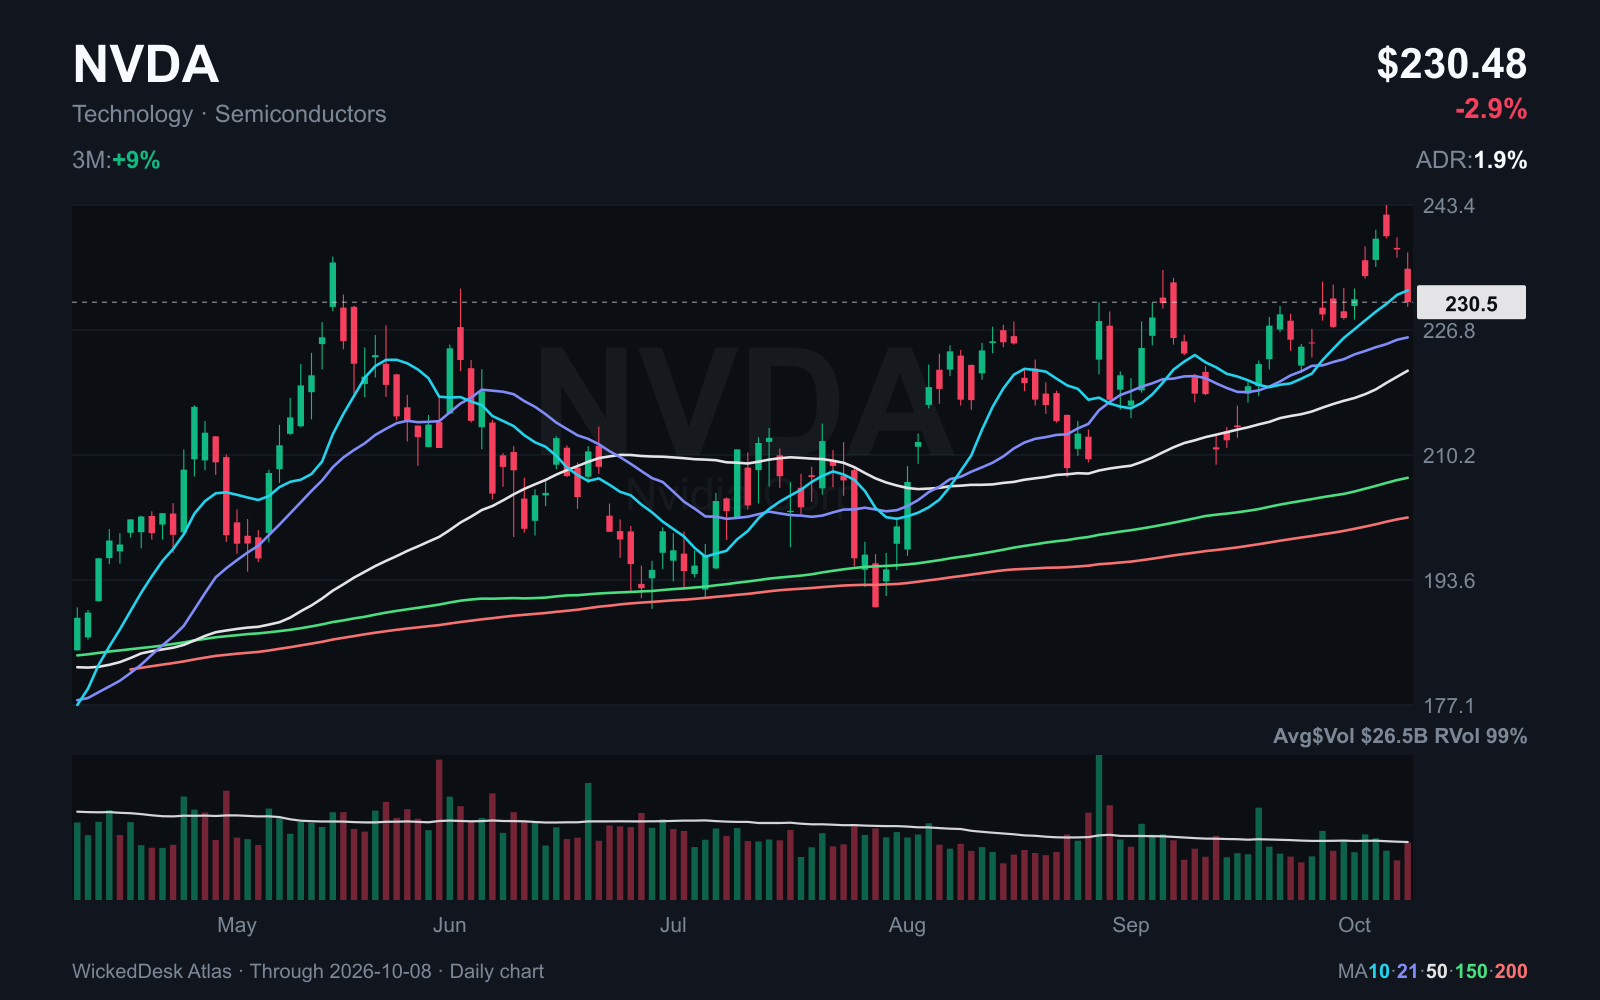
NVIDIA, Oracle, CoreWeave, AMD and Microsoft close lower on Thursday. The table now uses completed closing prices rather than yesterday’s intraday quotes. Oracle and CoreWeave suffer particularly large losses.
US Treasury yields fall at the same time. Higher market rates alone therefore cannot explain the selling. The OpenAI report coincides with the moves but does not establish its contribution to each stock’s loss. Next week, the question is whether buyers return or recoveries are sold again.
| Stock | Thursday close | Versus Wednesday |
|---|---|---|
| NVDA | 230.48 USD | -2.9% |
| ORCL | 135.69 USD | -5.5% |
| CRWV | 81.58 USD | -7.8% |
| AMD | 620.68 USD | -3.9% |
| MSFT | 522.61 USD | -1.3% |
- NVDA
- Thursday close
- 230.48 USD
- Versus Wednesday
- -2.9%
- ORCL
- Thursday close
- 135.69 USD
- Versus Wednesday
- -5.5%
- CRWV
- Thursday close
- 81.58 USD
- Versus Wednesday
- -7.8%
- AMD
- Thursday close
- 620.68 USD
- Versus Wednesday
- -3.9%
- MSFT
- Thursday close
- 522.61 USD
- Versus Wednesday
- -1.3%
NVIDIA and Oracle take on more than supply orders
NVIDIA discloses guarantees capped at $105 billion for an SB Energy project supporting an OpenAI related customer. They become effective in phases, initially expected in fiscal 2029, and can trigger payments following certain defaults. This is not an immediate bill. It shows that a supplier is also taking financing risk.
Oracle reported $664 billion in contracted obligations not yet recognized as revenue in September. Quarterly free cash flow was negative $5 billion. Not all of that backlog belongs to OpenAI. Capacity still needs to be built before it can earn money.
My reading: If paid demand falls behind construction plans, some projects could be delayed or reduced. Operators, chip suppliers and lenders would face different effects. That is a risk scenario, not a forecast of collapse. Growing demand, higher utilization and lower costs per request could also improve the economics.
A guarantee is not cash already paid. Contracted backlog is not cash in the bank. Adding these amounts together does not establish how much money is missing today. In coming reports I would instead track cash receipts, investment and utilization of new capacity.
TSMC grows. Its stock still falls.
TSMC reports September revenue of NT$511.86 billion, up 54.6% year on year but down 0.6% from August. January to September revenue grows 41.1%. Thursday’s release demonstrates demand but does not yet show quarterly profit margins.
Its US listed stock TSM falls 3.01% that day. Business results and price reactions need separate examination. Good operating figures do not guarantee a rising stock. TSMC’s October 15 quarterly results will provide further profit and outlook information.
Samsung provisionally estimates Q3 revenue of 195 trillion won and operating profit of 107.40 trillion won. Marvell’s Tuesday investor day instead provides a company outlook, not quarterly results.
| Event | Date | Result | Context |
|---|---|---|---|
| TSMC September revenue | October 8 | NT$511.86bn | +54.6% year on year, not quarterly profit |
| Samsung Q3 preliminary figures | October 8 | 195 trillion won revenue | Operating profit 107.40 trillion won, provisional |
| Marvell investor day | October 6 | Company outlook | Not a quarterly earnings report |
- TSMC September revenue
- Date
- October 8
- Result
- NT$511.86bn
- Context
- +54.6% year on year, not quarterly profit
- Samsung Q3 preliminary figures
- Date
- October 8
- Result
- 195 trillion won revenue
- Context
- Operating profit 107.40 trillion won, provisional
- Marvell investor day
- Date
- October 6
- Result
- Company outlook
- Context
- Not a quarterly earnings report
Yields fall. Financing remains expensive.
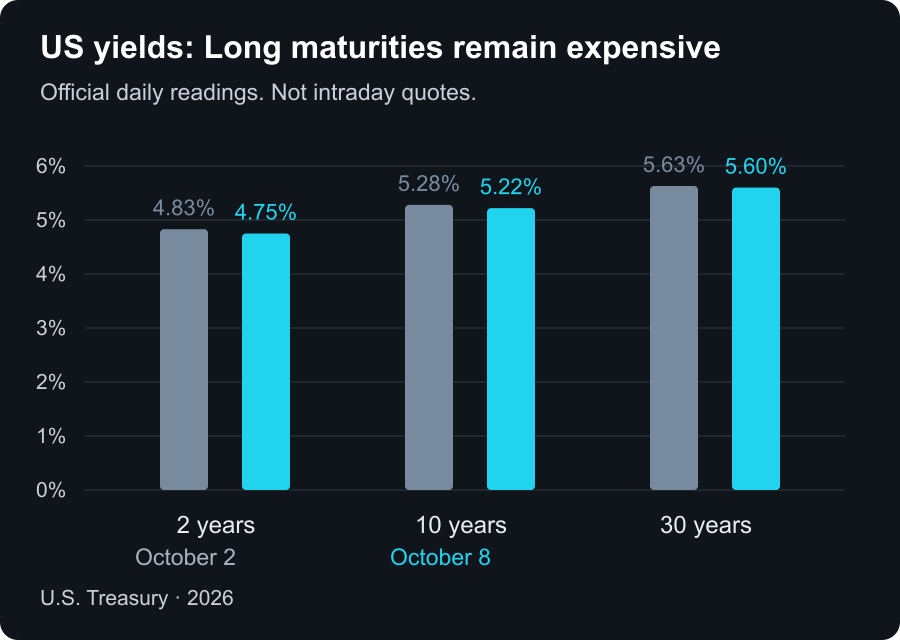
Official US Treasury yields fall on Thursday to 4.75% for two years, 5.22% for ten years and 5.60% for thirty years. All three decline versus Wednesday and the previous Friday.
That offers relief, not an end to expensive financing. Long construction projects require funding for years. Existing fixed rate debt does not immediately become cheaper or dearer. The timing of new borrowing and refinancing matters.
TLT, the long maturity US Treasury ETF, rises 0.94% on Thursday. Falling yields generally help existing bond prices, but holding long maturities still exposes investors to subsequent rate changes.
The Fed keeps another increase open
Wednesday's minutes cover the Fed's September meeting. Most participants judged another increase by year end likely appropriate. This was neither a new decision nor a commitment to raise rates.
Services continue to expand while their price indicators rise. The September ISM prices index reached 74.0. That is an index reading, not 74% inflation.
Higher rates can make borrowing more expensive, restrain investment and reduce the present value of profits expected far in the future. They cannot restore damaged energy infrastructure. Central banks can influence demand, not physically deliver more diesel.
What Changed The Weekly Plan
ISM services
Fed minutes
Initial unemployment claims
Higher rates do not solve Europe’s energy problem
The ECB deposit rate is 2.50% following September’s decision, an increase of 0.25 percentage points. Rates on new loans also depend on maturity, lender and credit risk. Higher financing costs can restrain construction and investment while companies already face larger energy bills.
This is the difficulty: weaker demand can dampen price increases, but it does not create additional gas deliveries. If energy and borrowing both become more expensive, companies may postpone investment even when new capacity is needed. Orders, lending and investment will show how far that develops.
Broad money M3 grew 3.5% year on year in August, after 3.4% in July. These figures precede September’s increase and demonstrate neither its success nor its failure. Slower lending can reduce the creation of bank deposits without necessarily shrinking the overall money supply.
Iran developments move oil prices
Brent settles Thursday at $104.28 per barrel, up 4.1%, according to AP. It retreats early Friday after Trump says he does not initially plan new strikes on Iran before the US midterm elections. An announcement is not the end of supply disruptions.
The EIA forecasts fourth quarter Brent averaging $105, $14 above its previous forecast. US distillate inventories stand 13.5% below a year earlier in the latest weekly release. Additional disruptions could therefore hit transport and production particularly hard. This does not establish a particular German filling station price.
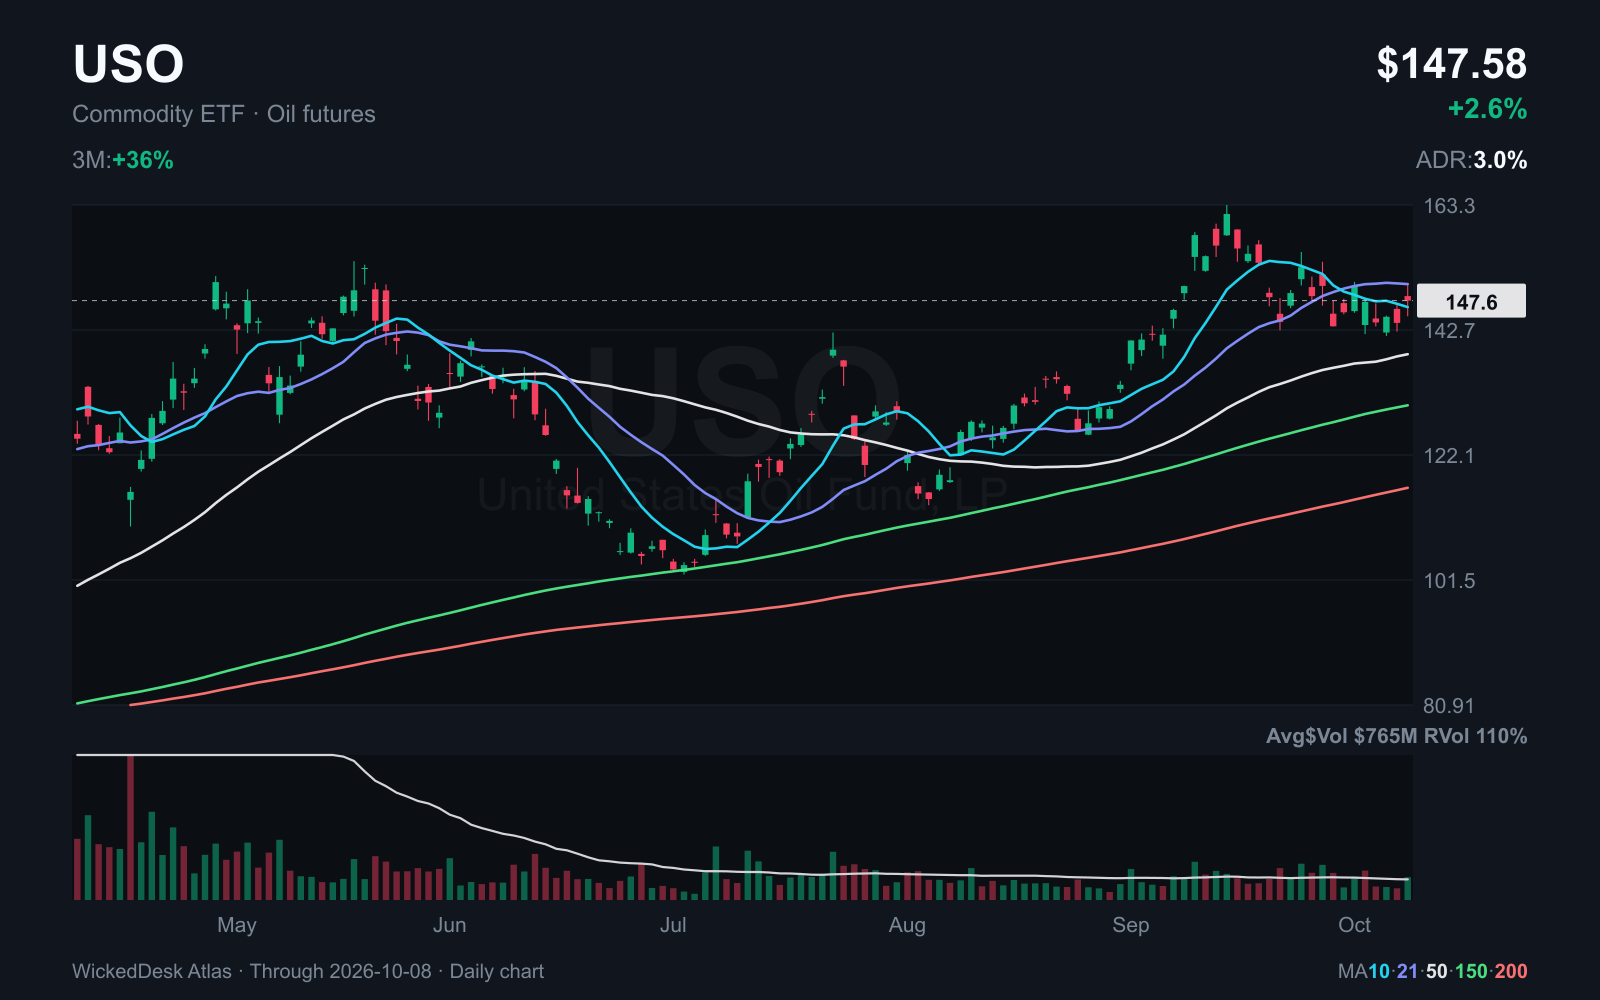
XLE gains +3.9% since the previous Friday, and USO +0.1%. XLE holds energy equities; USO tracks oil futures. Neither is the Brent price.
Gas reserves differ substantially
The GIE overview retrieved today, dated October 8 at 6 a.m. CEST, shows EU storage 73.12% full and Germany 59.44%. Inventories are only part of winter supply. Weather, continuing imports and consumption also matter.
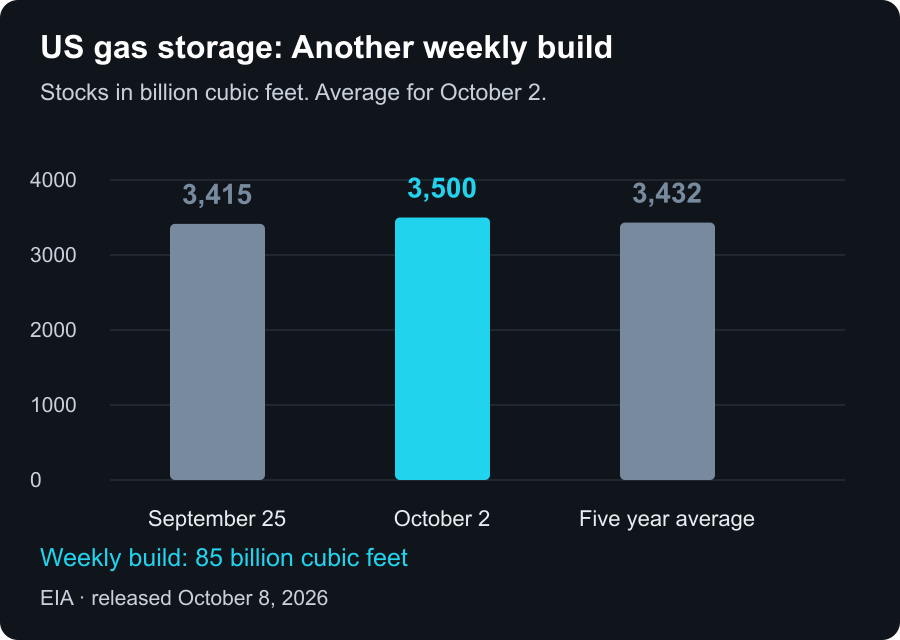
US inventories rise from 3,415 to 3,500 billion cubic feet in the week ending October 2, standing 2.0% above their five year average. The release was published October 8.
More US gas can help Europe but does not automatically become available supply. Liquefaction, ships and European terminals limit how much arrives and what it costs.
Revenue growth alone is not enough
EPS means earnings per share. Adjusted figures exclude selected special items. They can help compare ongoing operations, but do not replace the complete result under accounting rules. For US companies, GAAP commonly identifies those rules.
PepsiCo grew quarterly revenue 5.6% to $25.274 billion but lowered its annual core EPS growth outlook to 2.5% to 3.5%. Sales growth alone does not show how much reaches the bottom line.
Levi Strauss reported adjusted EPS of $0.48, including a net $0.11 benefit from tariff refunds. Organic sales grew 5%. Recurring operations and that separate benefit need different treatment.
Applied Digital reported revenue of $341.9 million, up 322%. Its GAAP continuing loss attributable to common shareholders was $221 million, with interest expense of $77.4 million. Revenue growth can coexist with construction costs, financing needs and substantial losses.
These companies face different questions. None of the figures replaces a suitable chart or a predefined exit.
The first complete price reaction differs: PepsiCo gains 3.73% on Thursday, Levi Strauss loses 2.36%, and Applied Digital opens 2.27% higher but finishes only 0.17% above the previous close. Its volume reaches 3.16 times the preceding 50 day average. Higher turnover does not establish a successful breakout.
What Changed The Weekly Plan
PepsiCo Q3
Levi Strauss Q3
Applied Digital Q1
SpaceX wants to enter the mobile carrier business
SpaceX wants Starlink to become a major mobile carrier in the United States. On October 8, it agreed to acquire Grain Management’s nationwide 800 MHz spectrum portfolio. The transaction still requires FCC approval and other closing conditions. A signed purchase agreement is not a completed network.
The plan combines satellites with ground infrastructure. The lower frequencies are intended to improve indoor coverage. Separately, SpaceX reports FCC authorization for 15,000 new mobile satellites. That is permission to expand, not a count of satellites already launched. These announcements do not yet establish a finished consumer plan with pricing and a firm US launch date.
The existing satellite service supplements mobile networks where cell towers cannot provide coverage. Starlink already lists T Mobile as a partner. Direct connections with existing LTE phones require a clear view of the sky. That differs from the proposed indoor coverage.
In Europe, Starlink’s role is currently more clearly that of a partner. Deutsche Telekom announced in March that service would begin in several European markets from 2028. The agreement covers ten countries. Future compatible smartphones would switch to satellites when terrestrial coverage is unavailable. This is planned expansion, not a service already available everywhere.
For investors, I would separate two questions: which operators face a new competitor, and which could use a partnership to close coverage gaps at lower cost? Starlink’s own plans could pressure incumbents’ pricing. Partnerships could instead add services they can sell. The outcome depends on prices, network quality, deployment costs and actual customer demand. Authorization alone does not answer that.
The group does not replace the individual chart
The retrieved WickedDesk ranking still places cybersecurity ahead of genomics and artificial intelligence. These metrics come from the stored group snapshot, not a separately calculated full week close.
Our completed daily charts show the differences: OKTA gains versus the previous Friday while CRWD and PANW decline. MRNA advances while CDNA and NTRA lose ground. A strong group rank does not make every member attractive.
For new candidates I want several liquid stocks in the same group containing their pullbacks. Individual chart structure, volume and a workable entry come next.
| Theme | Rank | Liquid stocks | Monthly momentum |
|---|---|---|---|
| Cybersecurity | 1 | 12 | +21.1% |
| Genomics | 2 | 7 | +23.0% |
| Artificial Intelligence | 3 | 19 | +10.4% |
- Cybersecurity
- Rank
- 1
- Liquid stocks
- 12
- Monthly momentum
- +21.1%
- Genomics
- Rank
- 2
- Liquid stocks
- 7
- Monthly momentum
- +23.0%
- Artificial Intelligence
- Rank
- 3
- Liquid stocks
- 19
- Monthly momentum
- +10.4%
We continue all nine stock studies
The watchlist does not restart every week. All nine stocks from issue 016 remain in the review. TWLO and CDNA lose particularly substantial ground versus the previous Friday. They do not disappear from the record. Their original ideas need reassessment.
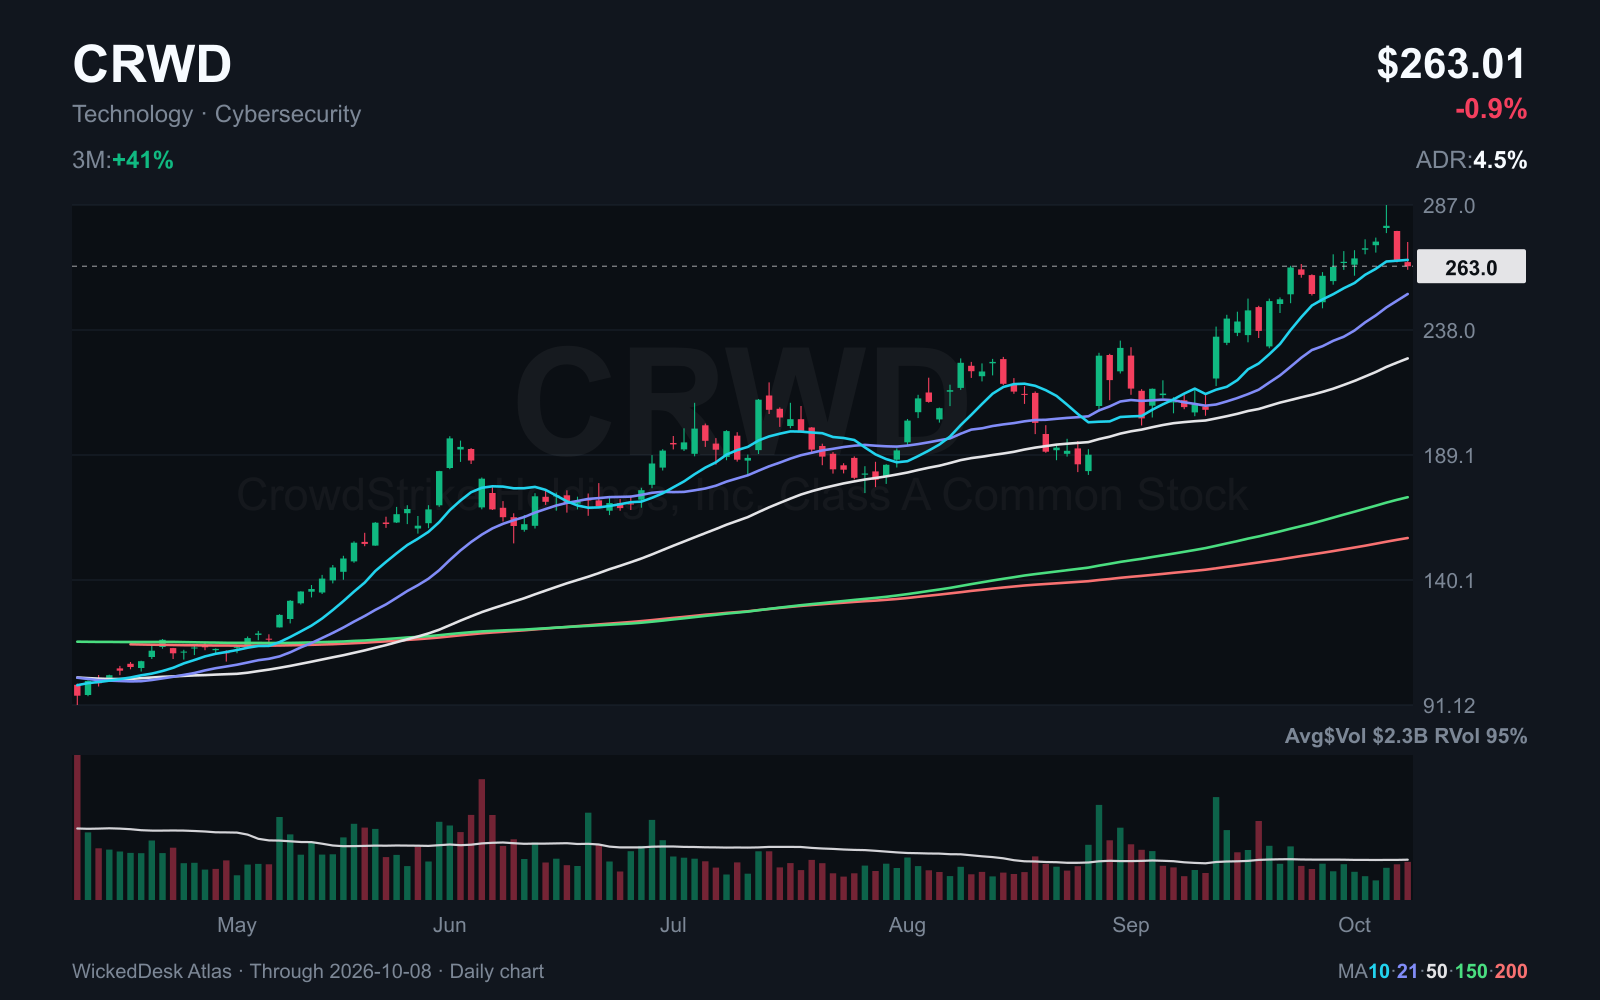
All nine remain above the 200 day SMA on Thursday. That is our first long filter, not an entry confirmation. MU and CRWD are now below their 10 day averages. That matters alongside their earlier strength.
| Stock | 200 day SMA | Thursday close | Since October 2 |
|---|---|---|---|
| MU | 697.92 USD | 1,035.84 USD | -3.6% |
| MRVL | 170.83 USD | 274.66 USD | +0.9% |
| MRNA | 71.68 USD | 197.00 USD | +3.7% |
| CRWD | 156.55 USD | 263.01 USD | -2.6% |
| OKTA | 114.71 USD | 220.21 USD | +4.1% |
| PANW | 254.78 USD | 398.50 USD | -1.2% |
| TWLO | 178.97 USD | 275.77 USD | -6.4% |
| CDNA | 29.66 USD | 62.21 USD | -7.4% |
| NTRA | 252.57 USD | 390.79 USD | -4.8% |
- MU
- 200 day SMA
- 697.92 USD
- Thursday close
- 1,035.84 USD
- Since October 2
- -3.6%
- MRVL
- 200 day SMA
- 170.83 USD
- Thursday close
- 274.66 USD
- Since October 2
- +0.9%
- MRNA
- 200 day SMA
- 71.68 USD
- Thursday close
- 197.00 USD
- Since October 2
- +3.7%
- CRWD
- 200 day SMA
- 156.55 USD
- Thursday close
- 263.01 USD
- Since October 2
- -2.6%
- OKTA
- 200 day SMA
- 114.71 USD
- Thursday close
- 220.21 USD
- Since October 2
- +4.1%
- PANW
- 200 day SMA
- 254.78 USD
- Thursday close
- 398.50 USD
- Since October 2
- -1.2%
- TWLO
- 200 day SMA
- 178.97 USD
- Thursday close
- 275.77 USD
- Since October 2
- -6.4%
- CDNA
- 200 day SMA
- 29.66 USD
- Thursday close
- 62.21 USD
- Since October 2
- -7.4%
- NTRA
- 200 day SMA
- 252.57 USD
- Thursday close
- 390.79 USD
- Since October 2
- -4.8%
Micron loses Wednesday’s recovery
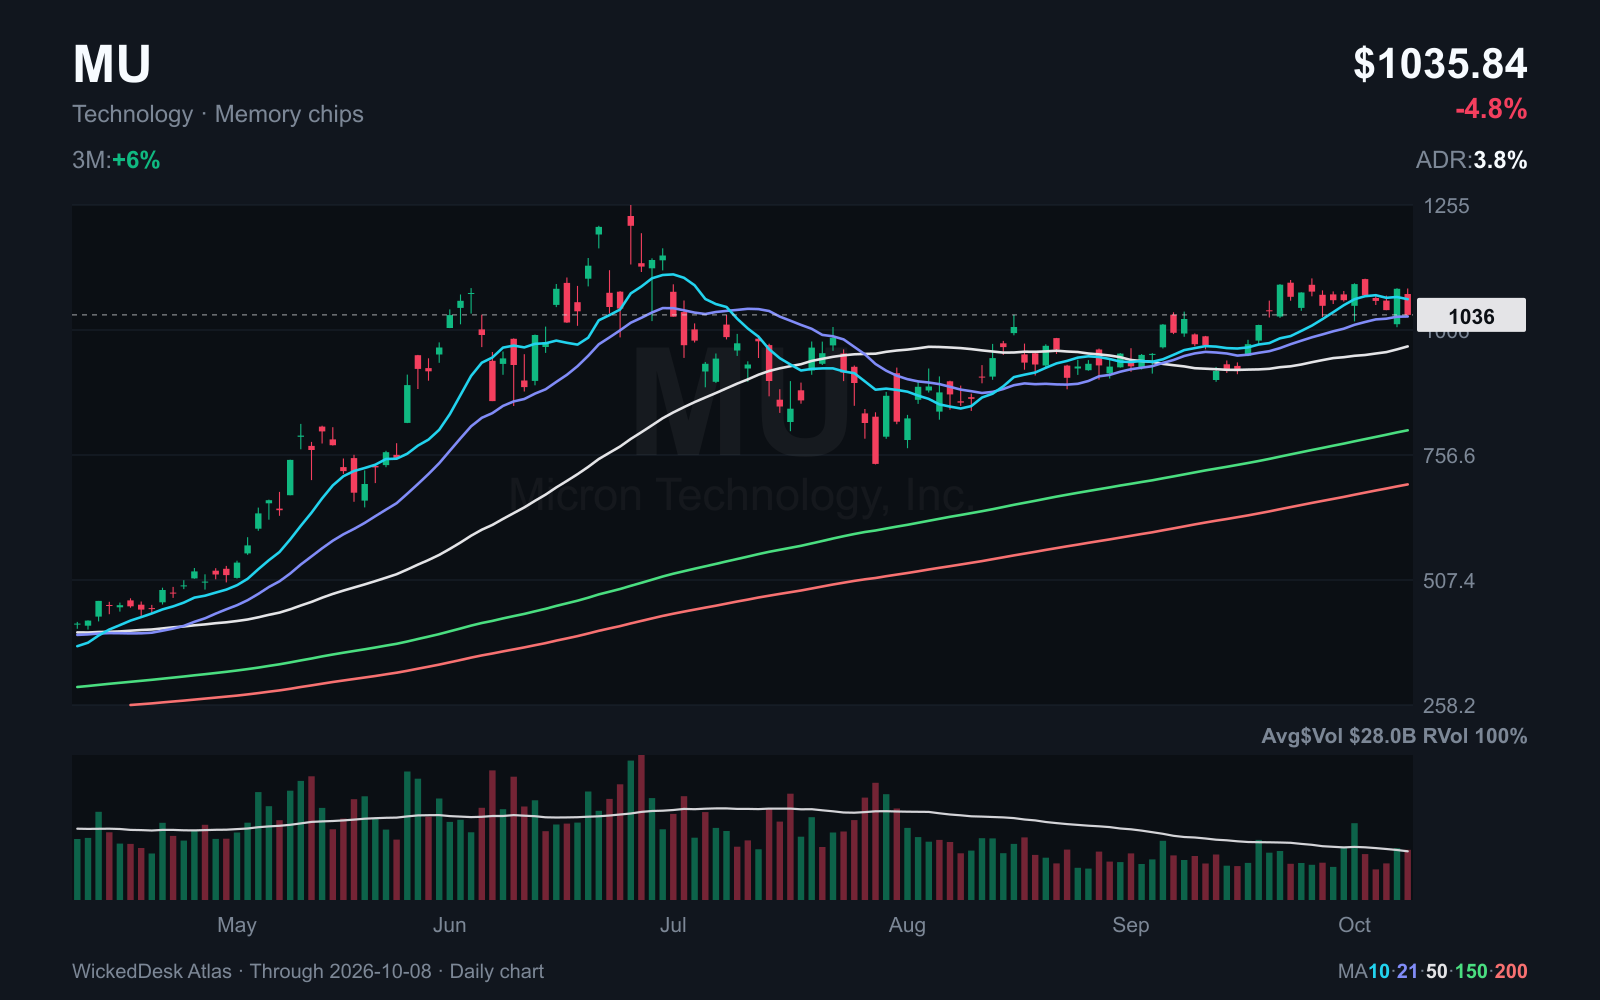
MU closes Thursday at $1,035.84, losing 4.79% that day. Wednesday’s recovery fails to hold. The close is back below its $1,067.21 10 day average and the existing $1,105.50 reference level.
A record quarter has not secured that zone. Before considering a continuation, I want buyers to return and reclaim it. Further losses below recent lows would argue against an early entry. The reference level remains unchanged. It is not a price target.
Marvell: Selling followed by a partial recovery
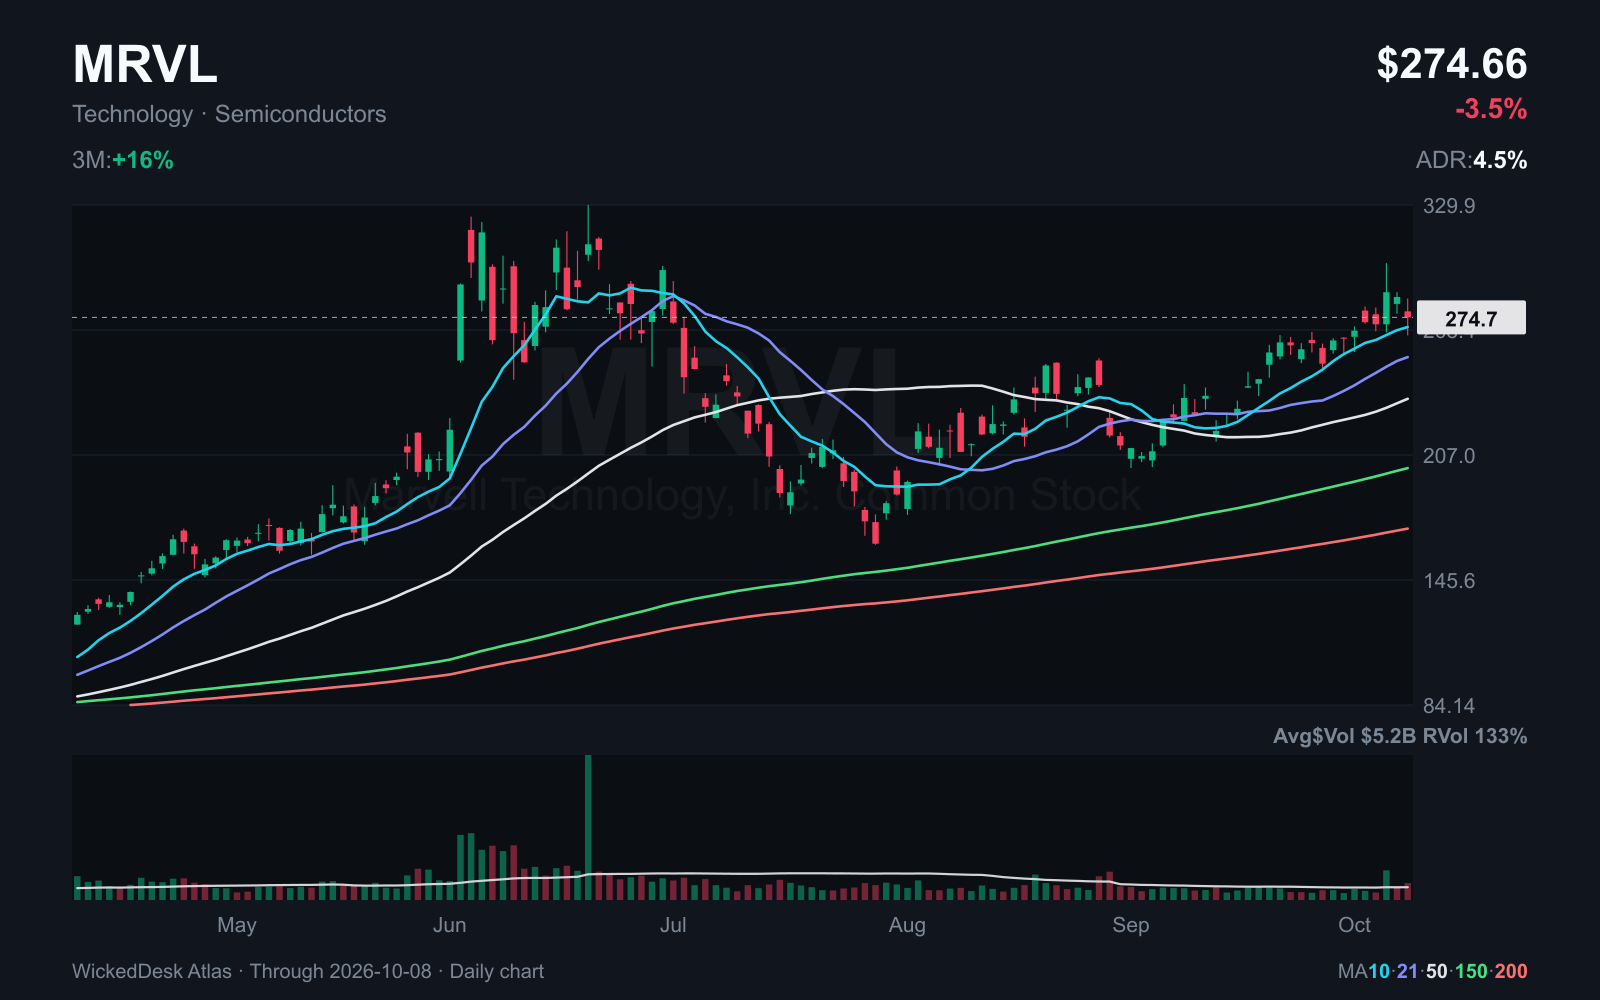
MRVL loses 3.52% on Thursday to $274.66. It recovers from the session low of $265.79 but closes below its opening price. Its $269.93 10 day average remains below the market.
The two completed sessions after investor day do not yet show a straightforward continuation. Next week I will watch whether pullbacks attract buyers or the stock falls back into its earlier range. A company outlook does not replace that check.
Moderna holds up despite technology selling
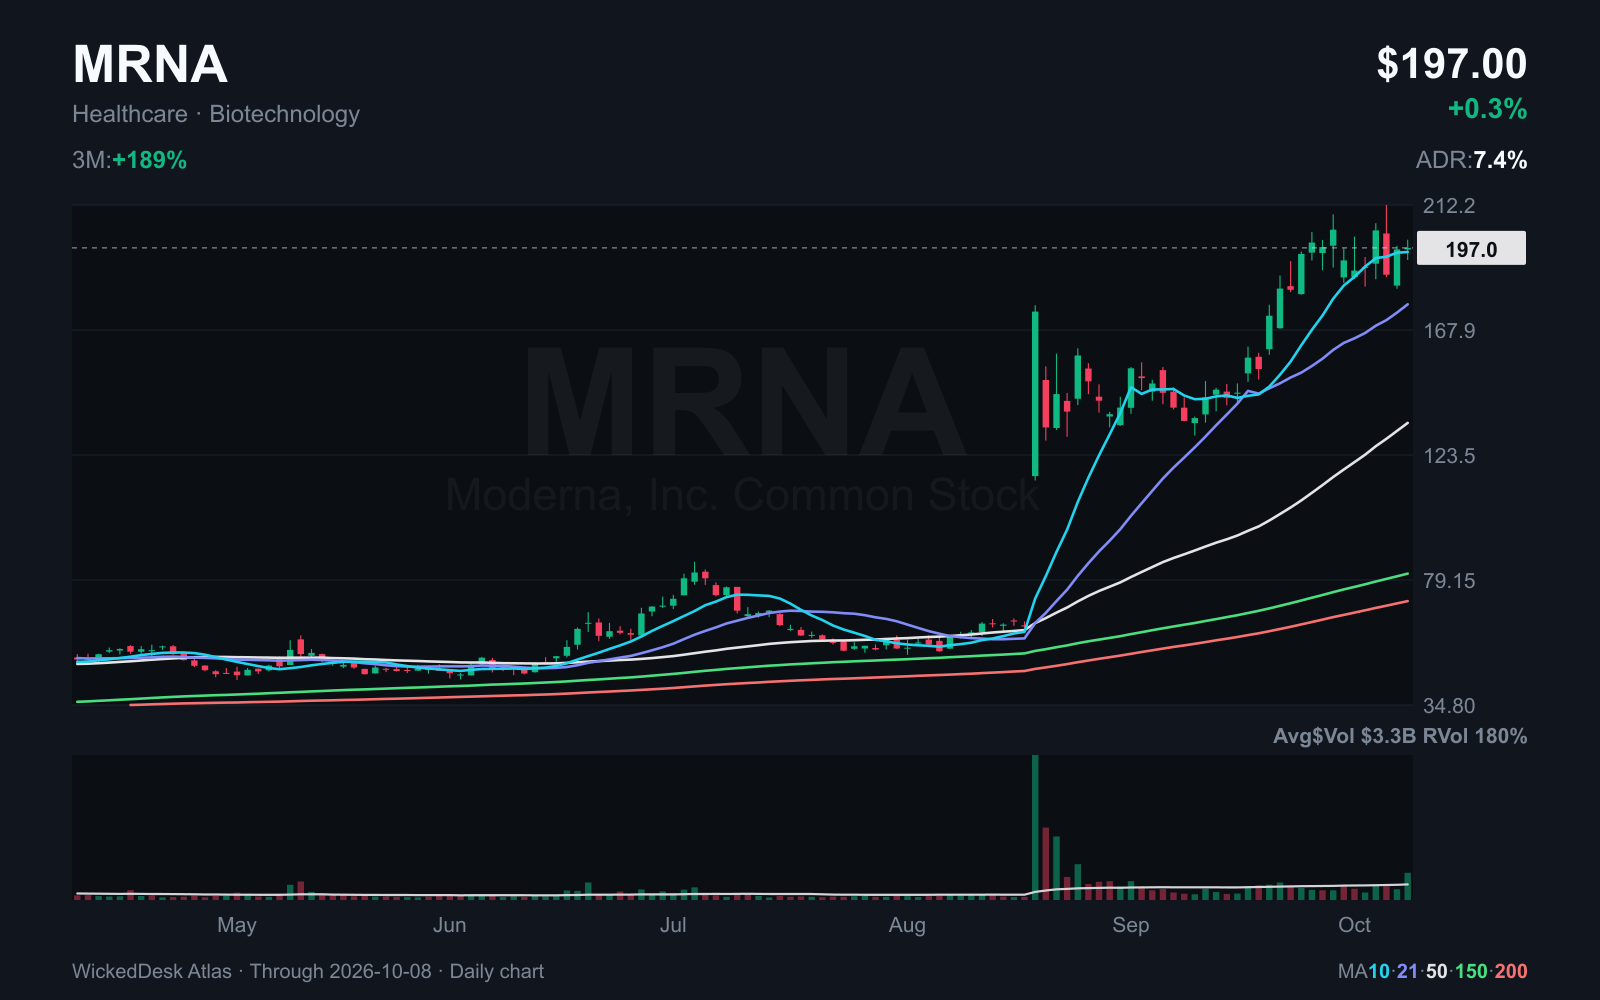
MRNA closes at $197.00, +3.7% versus the previous Friday. Thursday ranges from $192.71 to $199.92. That is narrower than Wednesday, although volume remains elevated at 1.80 times the preceding 50 day average.
This is a step toward smaller swings, not a completed tight base. I want to see several more contained sessions. The old $172.94 reference zone remains in place. Its distance below the price also shows why it would not by itself provide a sensible tight stop for a new trade.
CrowdStrike falls below its short average
CRWD closes at $263.01, below its $265.50 10 day average. Thursday’s intraday rise is given back. Looking only at the strong group rank would miss that weaker reaction.
The earlier $248.51 zone remains a lower reference. A new entry needs a contained structure and a defensible exit. Group membership and an old reference level alone are not enough.
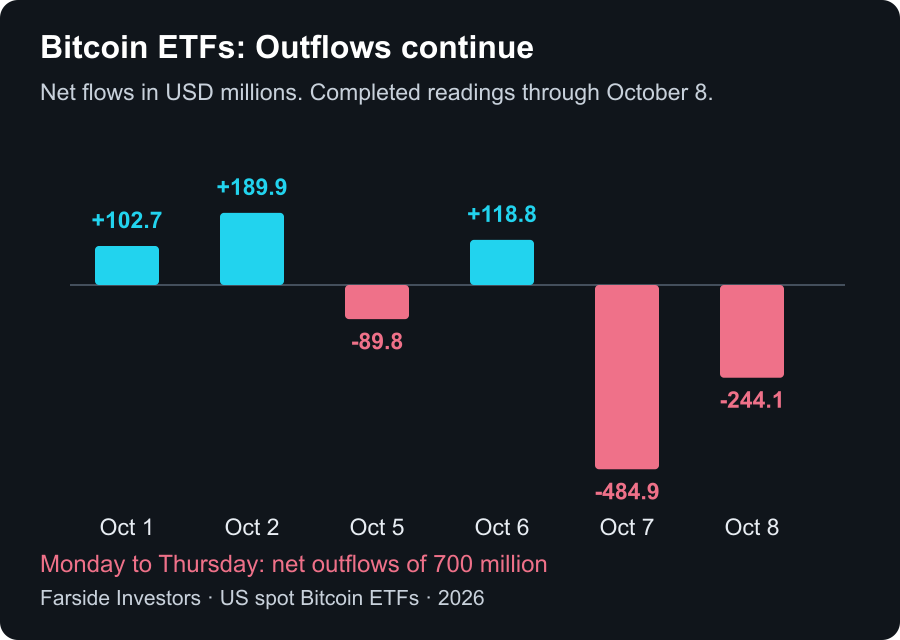
Further ETF outflows. Crypto equities remain weak.
US spot Bitcoin ETFs lose a net $244.1 million on Thursday. Combined with Wednesday, outflows reach $729 million. Monday through Thursday totals a net $700 million outflow. Still incomplete Friday fields are not counted as zero inflows.
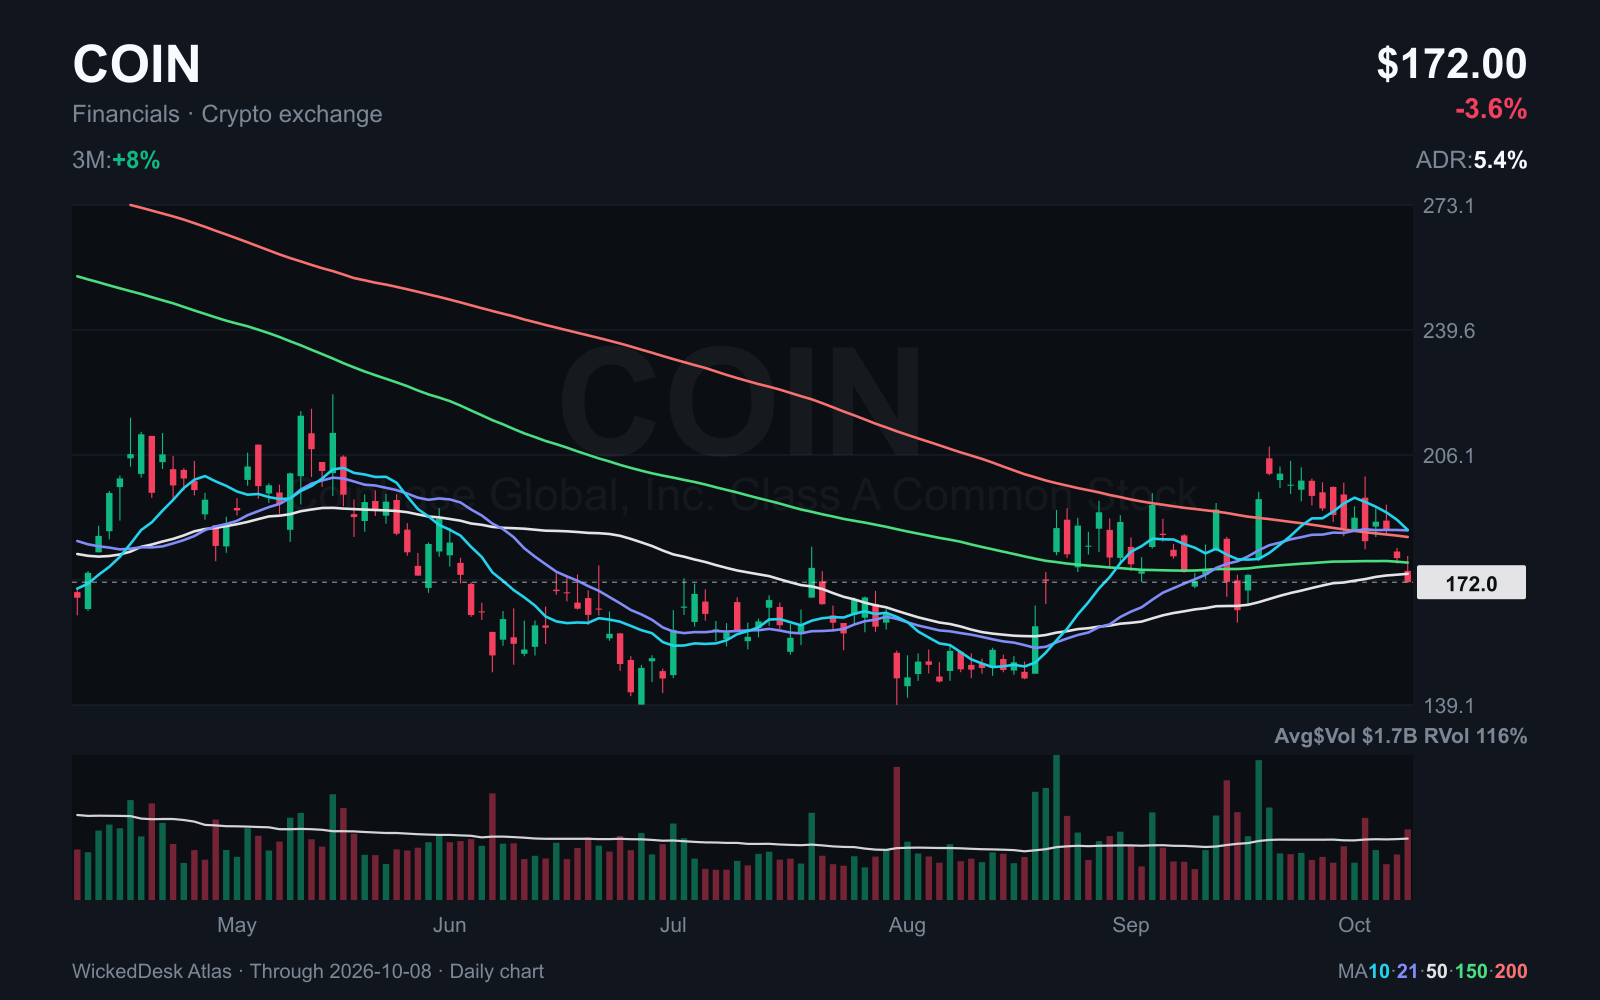
COIN closes at $172.00, below its $184.13 200 day SMA. HOOD and MSTR remain above their long term averages but also decline versus the previous Friday.
ETF demand, the Bitcoin price and crypto equities are different observations. Equity business models, financing and valuations differ. COIN fails our first filter for long preparation.
A higher price is not enough
PepsiCo rises after results and Applied Digital retains a small daily gain. Both remain below their 200 day SMA. Levi Strauss also fails our first long filter. The initial price reaction is now known, but these stocks do not yet qualify as suitable candidates.
GLD and SLV also remain below their long term averages. Gold and silver are not automatic protection against every market risk. These observations concern ETFs, not spot prices. Rates, liquidity needs and positioning can temporarily weigh on precious metals too.
| Name | Context | 200 day SMA | Thursday close |
|---|---|---|---|
| COIN | Below the first long filter | 184.13 USD | 172.00 USD |
| APLD | Below the first long filter | 32.11 USD | 23.85 USD |
| PEP | Below the first long filter | 146.79 USD | 128.34 USD |
| LEVI | Below the first long filter | 21.73 USD | 19.05 USD |
| GLD | Below the first long filter | 415.77 USD | 378.62 USD |
| SLV | Below the first long filter | 65.81 USD | 53.45 USD |
- Context
- Below the first long filter
- 200 day SMA
- 184.13 USD
- Thursday close
- 172.00 USD
- Context
- Below the first long filter
- 200 day SMA
- 32.11 USD
- Thursday close
- 23.85 USD
- Context
- Below the first long filter
- 200 day SMA
- 146.79 USD
- Thursday close
- 128.34 USD
- Context
- Below the first long filter
- 200 day SMA
- 21.73 USD
- Thursday close
- 19.05 USD
- GLD
- Context
- Below the first long filter
- 200 day SMA
- 415.77 USD
- Thursday close
- 378.62 USD
- SLV
- Context
- Below the first long filter
- 200 day SMA
- 65.81 USD
- Thursday close
- 53.45 USD
Next week: Banks, inflation and TSMC
US equities trade normally on Monday. SIFMA recommends a US bond market holiday closure. Equity and yield moves therefore need to be read against different trading conditions that day.
JPMorgan and Bank of America then begin the next round of earnings. Higher rates do not automatically help banks if loan demand weakens or defaults rise. Wednesday’s US consumer prices and Thursday’s producer prices will show whether energy costs are spreading more broadly.
TSMC reports Thursday. Following strong September revenue, I want to see how margins, investment and the outlook fit. New developments involving Iran could also move oil prices.
We continue our stock studies. MU needs to reclaim its existing reference level, MRVL needs buyers after investor day, and MRNA needs several contained sessions. A good report does not require a trade. If entry and exit do not fit sensibly, the stock remains a study.
| Event | Day | Focus |
|---|---|---|
| US bond market holiday | Monday, October 12 | NYSE open normally; SIFMA recommends a bond market closure |
| JPMorgan earnings | Tuesday, October 13 | Loan demand, credit losses and margins |
| Bank of America earnings | Wednesday, October 14 | Comparison with JPMorgan |
| US consumer prices | Wednesday, October 14, 8:30 a.m. ET | Energy, core inflation and yields |
| TSMC earnings | Thursday, October 15 | Margins, investment and outlook |
| US producer prices | Thursday, October 15, 8:30 a.m. ET | Costs before final consumer sales |
- US bond market holiday
- Day
- Monday, October 12
- Focus
- NYSE open normally; SIFMA recommends a bond market closure
- JPMorgan earnings
- Day
- Tuesday, October 13
- Focus
- Loan demand, credit losses and margins
- Bank of America earnings
- Day
- Wednesday, October 14
- Focus
- Comparison with JPMorgan
- US consumer prices
- Day
- Wednesday, October 14, 8:30 a.m. ET
- Focus
- Energy, core inflation and yields
- TSMC earnings
- Day
- Thursday, October 15
- Focus
- Margins, investment and outlook
- US producer prices
- Day
- Thursday, October 15, 8:30 a.m. ET
- Focus
- Costs before final consumer sales