
Micron delivers. Now watch what buyers do.
In the previous issue, Micron was still waiting to report. Now we have the results: $54.2 billion of revenue in one quarter, against $11.3 billion a year earlier. If you were looking for weak memory demand, this report does not show it.
I would not turn that into a prediction that the stock has to rise. Micron has already advanced sharply over recent months. Investors value future earnings as well as reported earnings, and they pay a price for those expectations. That is why the report belongs next to the chart.
This week adds another question: What happens to expensive stocks when safe government bonds offer more yield? And which companies can pass higher energy costs on to customers without losing business?
Five numbers worth looking at this week
Micron’s record revenue is only part of the week. Companies, households and investors are dealing with higher input prices and higher financing costs at the same time.
| Item | Value | Meaning |
|---|---|---|
| Micron quarterly revenue | $54.229bn | Against $11.315bn a year earlier |
| Ten year Treasury yield | 5.24% | Thursday. Previous Friday: 5.17% |
| German energy prices | +14.9% | September against the previous year, preliminary |
| US manufacturing input prices | 77.9 | ISM subindex. August: 71.1 |
| New US jobs | 29,000 | September. Previous months revised down by a combined 60,000 |
- Micron quarterly revenue
- Value
- $54.229bn
- Meaning
- Against $11.315bn a year earlier
- Ten year Treasury yield
- Value
- 5.24%
- Meaning
- Thursday. Previous Friday: 5.17%
- German energy prices
- Value
- +14.9%
- Meaning
- September against the previous year, preliminary
- US manufacturing input prices
- Value
- 77.9
- Meaning
- ISM subindex. August: 71.1
- New US jobs
- Value
- 29,000
- Meaning
- September. Previous months revised down by a combined 60,000
Technology holds up better than smaller stocks
All four major index ETFs lose ground from Friday through Thursday. QQQ falls 0.3%, SPY and IWM about 1% each. Large technology stocks show relative strength, but that is not a broad advance.
QQQ is above its 10 and 50 day averages. IWM is below both and only slightly above its 200 day SMA. Will the next advance bring buyers into smaller companies too?
Tables and charts compare completed daily candles through Thursday, October 1. Friday’s ongoing session is not included. Today’s jobs report is discussed separately.
| Symbol | Tracks | Since Friday | Thursday close |
|---|---|---|---|
| SPY | S&P 500 | -1.0% | $763.99 |
| QQQ | Nasdaq 100 | -0.3% | $742.03 |
| DIA | Dow Jones | -1.7% | $508.62 |
| IWM | Russell 2000 | -1.0% | $279.02 |
- Tracks
- S&P 500
- Since Friday
- -1.0%
- Thursday close
- $763.99
- Tracks
- Nasdaq 100
- Since Friday
- -0.3%
- Thursday close
- $742.03
- Tracks
- Dow Jones
- Since Friday
- -1.7%
- Thursday close
- $508.62
- Tracks
- Russell 2000
- Since Friday
- -1.0%
- Thursday close
- $279.02
QQQ stays close to its high
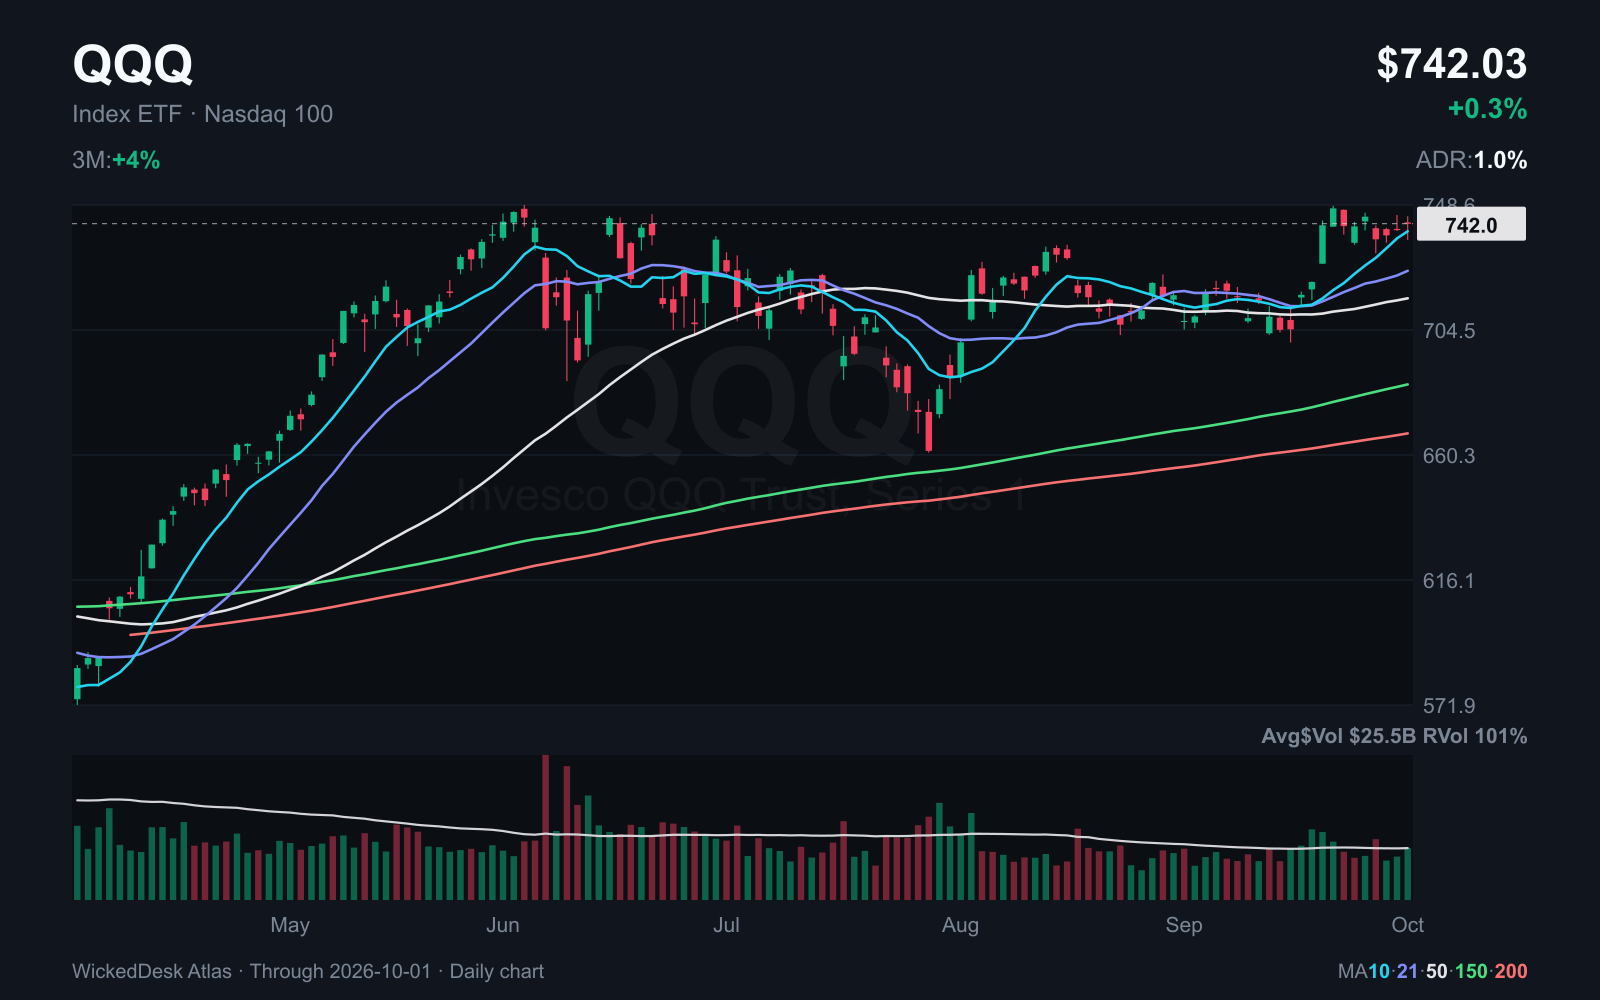
QQQ closes Thursday at $742.03. The ETF is above its moving averages, which are average closing prices over a specified period. Recent sessions have not produced a sustained move away from the previous high.
Next week, I want to see whether the recent lows hold and whether a further advance reaches beyond large technology stocks. A higher index alone does not answer that. The red line is the 200 day SMA, the average of the previous 200 trading day closes.
$54 billion of revenue in three months
Micron reports $54.229 billion of revenue for its fourth fiscal quarter. That compares with $41.456 billion in the third quarter and $11.315 billion a year earlier. Adjusted earnings per share reach $33.42 and adjusted gross margin is 87%. Gross margin measures how much revenue remains after direct production costs.
The outlook matters even more for valuation. Micron guides to $61.5 billion of revenue in the first quarter of its new fiscal year, plus or minus $1.5 billion. Adjusted earnings per share are expected to reach $38.15, plus or minus $1. This is guidance, not money already earned.
Demand also brings more capacity. Micron invested $27.37 billion during the completed fiscal year. For investors, the question remains: How long can demand and pricing hold when manufacturers expand production? A strong quarter does not automatically explain a later year.
| Metric | Value |
|---|---|
| Quarterly revenue | $54.229bn |
| Revenue a year earlier | $11.315bn |
| Adjusted earnings per share | $33.42 |
| Adjusted gross margin | 87% |
- Quarterly revenue
- Value
- $54.229bn
- Revenue a year earlier
- Value
- $11.315bn
- Adjusted earnings per share
- Value
- $33.42
- Adjusted gross margin
- Value
- 87%
Micron finds buyers after earnings
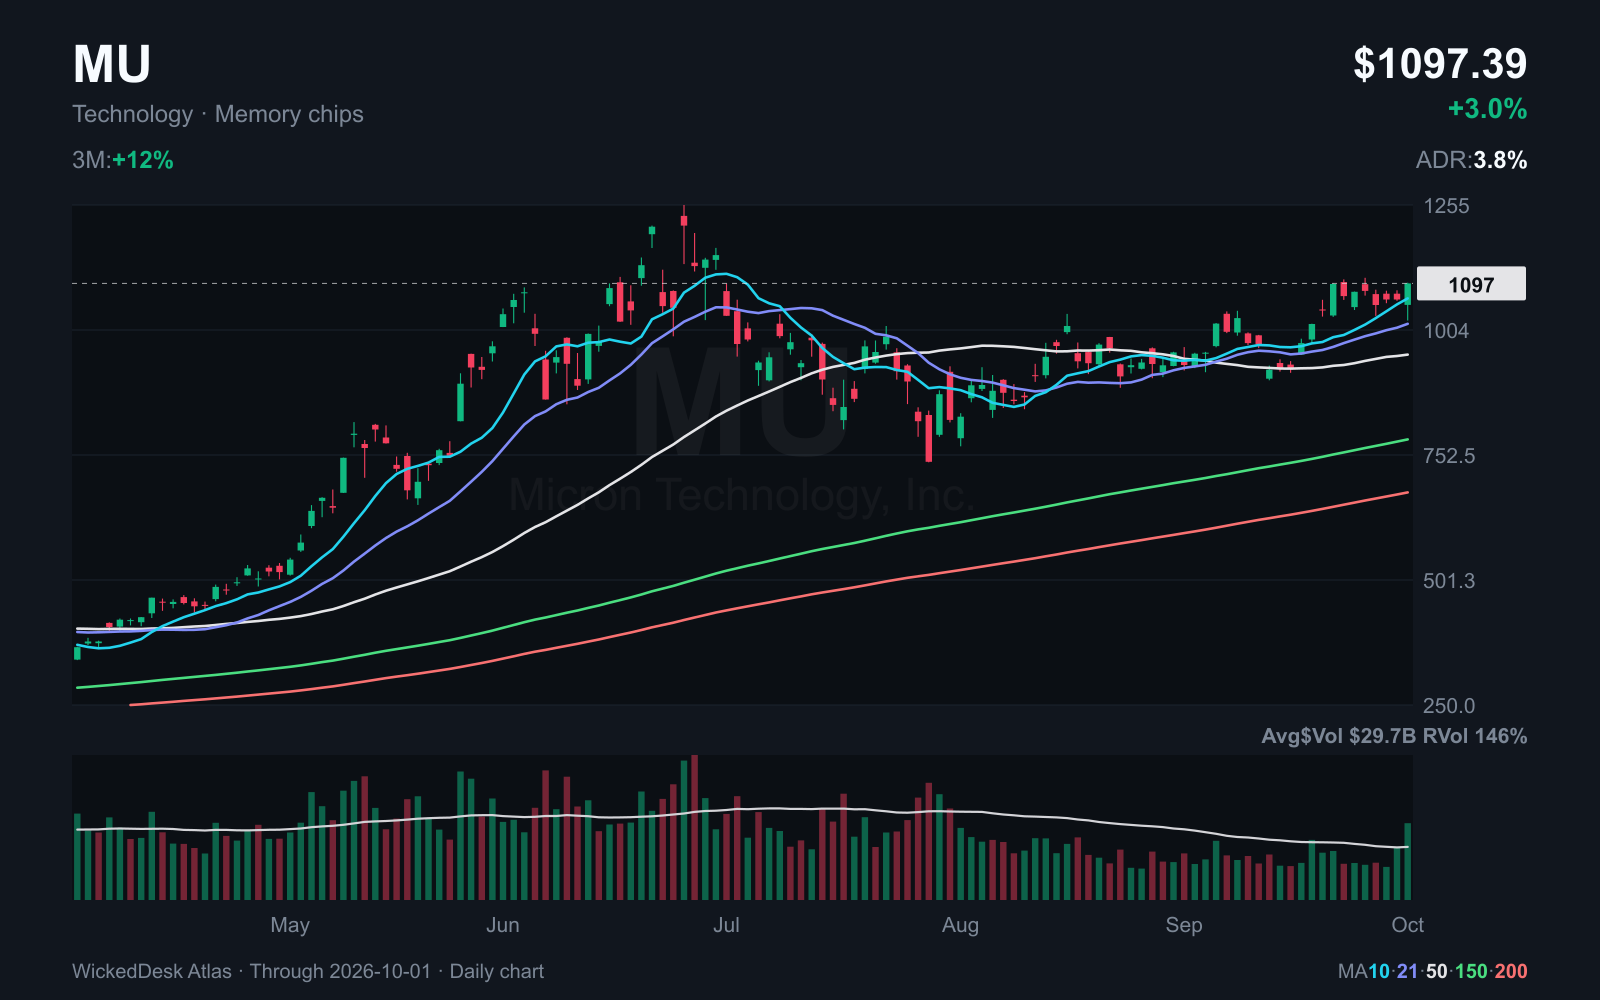
Micron opens Thursday about 1% below the previous close. From a low of $1,022.90, the stock recovers to close at $1,097.39. That is a 3% daily gain and a finish near the session high. Volume is roughly 46% above the average of the preceding 50 sessions.
Buyers absorb the first pullback after the report. The close still does not clear the $1,105.50 area from issue 015. This is not a confirmed breakout.
Next week, I want to see whether the stock holds this advance and moves above that area. Micron remains an event study. Record results alone do not make an entry cheap.
NIKE sales weaken, Carnival holds demand
NIKE reports $11.2 billion of revenue after Thursday’s close, down 4% from a year earlier. Direct sales fall 8%. Gross margin still improves to 42.8%, with earnings per share of $0.48. NIKE expects a high single digit revenue decline for the fiscal year. This is initially a company specific problem, not proof of a broad collapse in consumption.
Carnival reports about $2 billion of adjusted quarterly profit and adjusted earnings per share of $1.43. Fuel and currency movements together reduce earnings by $131 million against its June guidance. Customer deposits are roughly 7% higher than a year earlier and 2027 bookings are at record levels. Higher costs do not automatically mean weak demand here.
At Conagra, organic sales fall 1.1%. Adjusted earnings per share still rise 5.1% to $0.41. The company keeps its full year outlook. For coming food company reports, the question is whether margins can hold while sales volumes or organic sales weaken.
NVIDIA approves an additional $150 billion of share repurchases on Monday. Authorization is not evidence that the money has already been spent. It creates capacity for future purchases.
What Changed The Weekly Plan
NIKE quarterly results
Carnival quarterly results
Conagra quarterly results
NVIDIA share repurchases
Few new jobs, higher input prices
Today’s US jobs report records 29,000 additional nonfarm jobs in September. Unemployment stays at 4.2%. July and August are revised down by a combined 60,000 jobs. Average hourly earnings rise 3% from a year earlier.
Alongside that sits ISM Manufacturing: 54.5 against 54.6 in August. New orders rise to 55.3 and the input price index climbs from 71.1 to 77.9. These are index points, not an inflation rate. In the price index, above 50 means more businesses report rising than falling input prices.
That combination is uncomfortable for the Fed. Weak hiring points to a more cautious economy. Higher input costs can still feed inflation. A rate cut is not automatically the next answer. ADP and JOLTS add context, but measure different areas and reporting periods.
What Changed The Weekly Plan
US employment
ISM Manufacturing
ADP employment
JOLTS job openings
Energy prices rise, core inflation remains lower
Germany’s preliminary annual inflation rate rises from 2.9% to 3.3% in September. Energy costs 14.9% more than a year earlier. Excluding energy and food, core inflation stays at 2.4%. Services rise 2.7% and food 0.4%. Prices are not rising at the same pace everywhere.
In the US, August PCE inflation is 3.4%, with core inflation at 3%. PCE measures prices for personal consumption expenditures and is one of the Fed’s main inflation measures. Real consumer spending rises 0.6% from July while real disposable income is unchanged. The saving rate is 4.1%.
Will energy costs feed further into transport, production and services? Or will households reduce other spending? Company earnings depend heavily on which of those developments dominates.
Yields ease slightly but remain high
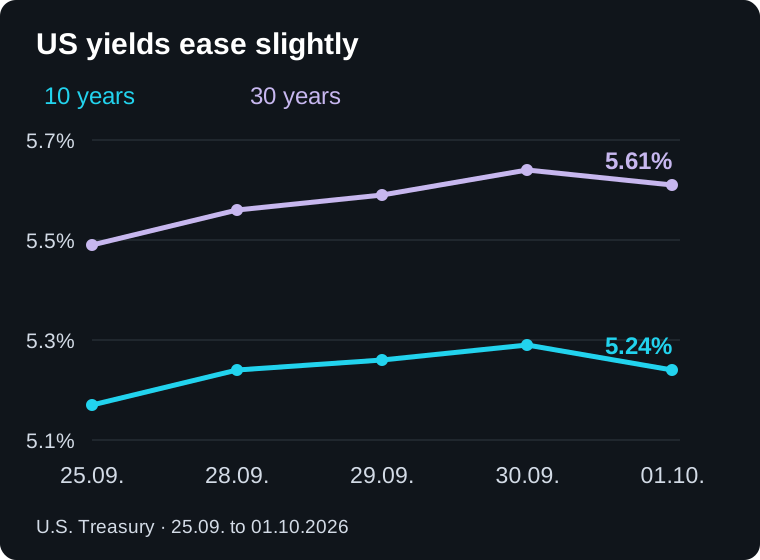
The ten year Treasury yield falls from 5.29% to 5.24% on Thursday. The thirty year falls from 5.64% to 5.61%. Both remain above the previous Friday, by seven and twelve basis points. One basis point equals 0.01 percentage points.
Treasuries still offer high nominal yields. Expected stock earnings must compete with that yield, potential inflation and company risk.
When an existing bond’s yield rises, its price falls. Longer maturities generally react more strongly. New borrowing becomes more expensive for governments and companies. Today’s jobs report comes after these Thursday readings. They cannot yet show its effects.
Higher rates do not remove money from everywhere at once
The ECB raised its deposit rate to 2.5% in September. The Fed raised its target range to 3.75% to 4%. These decisions belong to previous weeks, not this week.
Their effects take time. Euro area broad money, M3, still grows 3.5% from a year earlier in August. Corporate lending grows 4.2% and household lending 3.1%. These figures predate the September rate increase and cannot demonstrate its effects.
August bank rates also differ. New corporate loans cost a weighted average of 3.77% and new housing loans 3.60%. The rate on new consumer credit rises to 7.92%. Money does not become equally expensive for everyone. A household carrying debt, a homebuyer and a company holding cash experience the same rate decision very differently.
If energy keeps inflation elevated while credit costs slow demand, central banks face a harder task. Higher rates do not repair a damaged pipeline or produce more fuel. They can weaken other consumption and investment.
More crude oil does not automatically mean cheaper diesel
US crude inventories rise by 0.9 million barrels to 427.3 million in the week ending September 25. That is about 2% above the five year average. Gasoline and distillates are different: Inventories are 7% and 14% below their five year averages. Distillates include diesel.
That is why watching only the crude price is not enough. Refining capacity, product inventories, transport routes and regional demand also affect pump prices. US refineries operate at 92.5% utilization during this week.
US natural gas inventories rise by 64 billion cubic feet to 3,415 billion. That is 2.4% above the five year average but 3.9% below a year earlier. US storage is not a substitute for European storage and gas prices. Europe’s winter requirements also depend on weather, imports and industrial demand.
Genomics and Cybersecurity stay in front
In Friday’s 16:03 CEST snapshot, Technology ranks ahead of Healthcare and Communication in WickedDesk’s sector ranking. Genomics leads Cybersecurity among themes. They swap positions against Thursday. Artificial intelligence stays third while Cloud drops from fourth to sixth.
A rank tells you little about the stock you want to trade. CRWD and OKTA keep advancing through Thursday. MRNA loses 5% against the previous Friday. The same strong theme can contain very different charts.
The graphic compares two actual ranking snapshots, Thursday and Friday. The ranking combines several measures. It is not a table of weekly returns.
| Group | Rank Friday 16:03 |
|---|---|
| Technology | 1 |
| Healthcare | 2 |
| Communication | 3 |
| Energy | 4 |
- Technology
- Rank Friday 16:03
- 1
- Healthcare
- Rank Friday 16:03
- 2
- Communication
- Rank Friday 16:03
- 3
- Energy
- Rank Friday 16:03
- 4

What happened to the previous issue’s list
The nine stocks from issue 015 stay on the study list. Through Thursday, TWLO gains 9.2%, OKTA 8.9%, PANW 5.7% and CRWD 5.5%. CDNA also advances. MRNA loses 5%, while Micron finds buyers after its report.
All nine are above their 200 day SMA on Thursday. That is the first filter for these long studies, not a completed setup. Next come the trading range, the distance to a potential entry and the point where the idea fails. This list records the ongoing observations. It is not a new buy recommendation.
| Symbol | Friday | Status | Thursday | Since Friday |
|---|---|---|---|---|
| CRWD | $252.13 | Above 200 day SMA | $266.09 | +5.5% |
| OKTA | $195.19 | Above 200 day SMA | $212.63 | +8.9% |
| PANW | $374.74 | Above 200 day SMA | $396.25 | +5.7% |
| NTRA | $412.56 | Above 200 day SMA | $408.47 | -1.0% |
| CDNA | $63.68 | Above 200 day SMA | $66.23 | +4.0% |
| TWLO | $275.80 | Above 200 day SMA | $301.27 | +9.2% |
| MRNA | $198.88 | Pullback, above 10 day SMA | $188.94 | -5.0% |
| MRVL | $261.94 | Above 200 day SMA | $268.08 | +2.3% |
| MU | $1,082.28 | Buyers after earnings | $1,097.39 | +1.4% |
- Friday
- $252.13
- Status
- Above 200 day SMA
- Thursday
- $266.09
- Since Friday
- +5.5%
- Friday
- $195.19
- Status
- Above 200 day SMA
- Thursday
- $212.63
- Since Friday
- +8.9%
- Friday
- $374.74
- Status
- Above 200 day SMA
- Thursday
- $396.25
- Since Friday
- +5.7%
- Friday
- $412.56
- Status
- Above 200 day SMA
- Thursday
- $408.47
- Since Friday
- -1.0%
- Friday
- $63.68
- Status
- Above 200 day SMA
- Thursday
- $66.23
- Since Friday
- +4.0%
- Friday
- $275.80
- Status
- Above 200 day SMA
- Thursday
- $301.27
- Since Friday
- +9.2%
- Friday
- $198.88
- Status
- Pullback, above 10 day SMA
- Thursday
- $188.94
- Since Friday
- -5.0%
- Friday
- $261.94
- Status
- Above 200 day SMA
- Thursday
- $268.08
- Since Friday
- +2.3%
- Friday
- $1,082.28
- Status
- Buyers after earnings
- Thursday
- $1,097.39
- Since Friday
- +1.4%
MRNA needs a narrower trading range first
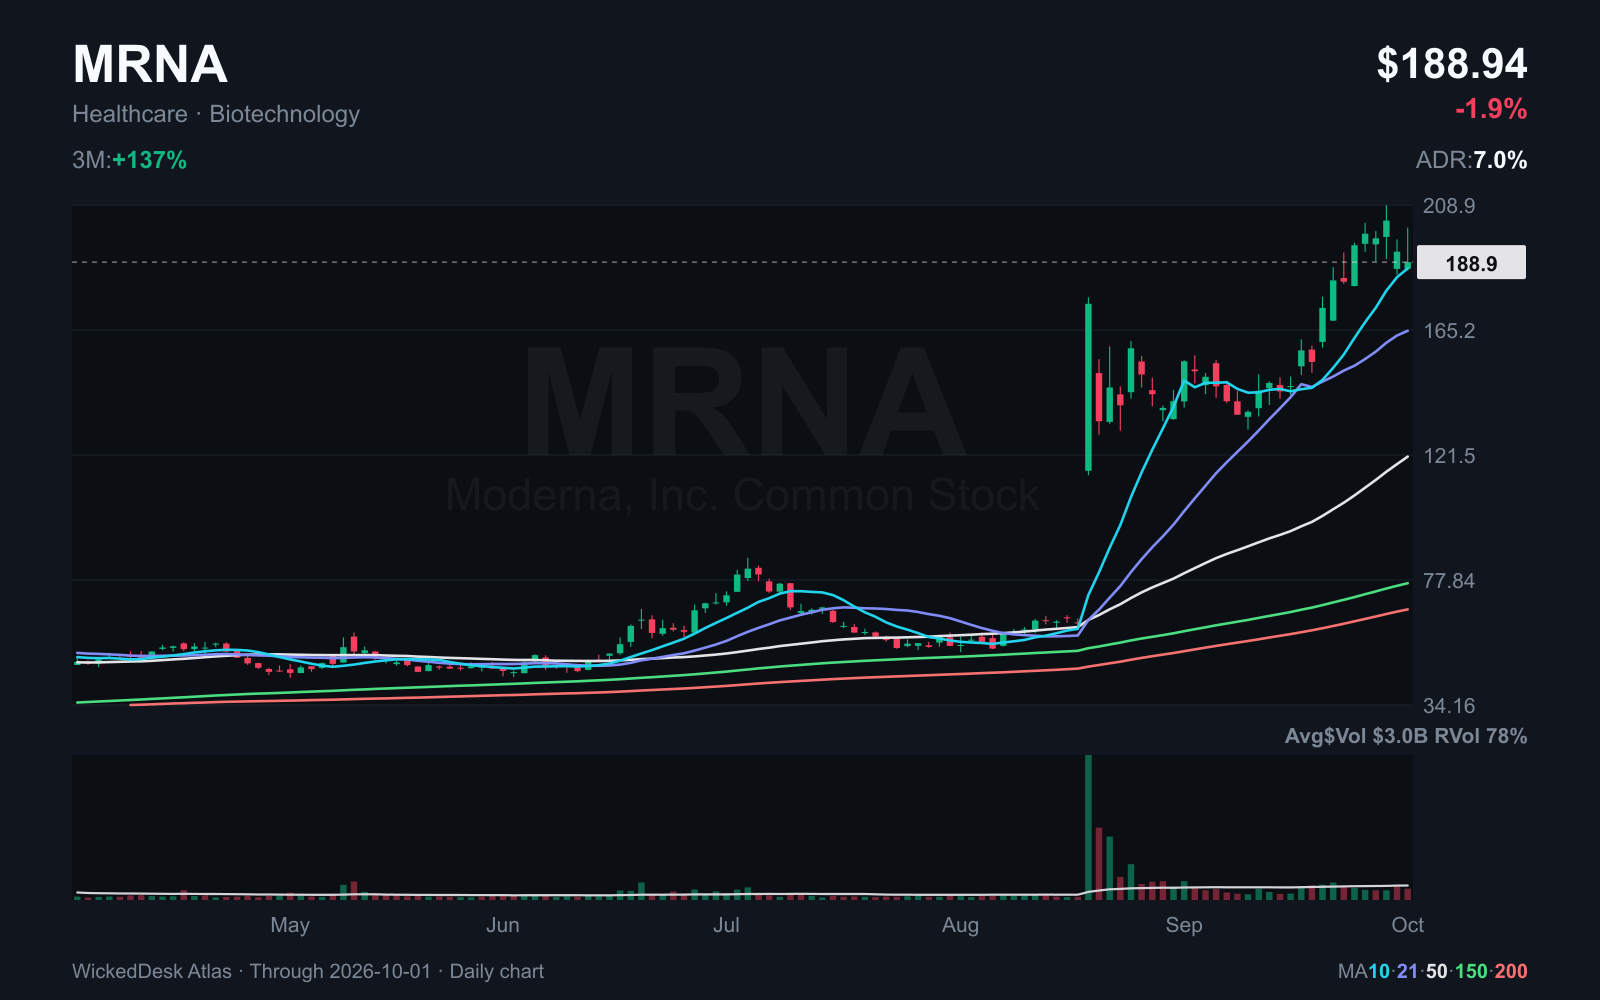
MRNA closes Thursday at $188.94, down 5% against the previous Friday. It remains slightly above its 10 day average at $186.76 and well above its 200 day SMA.
Thursday ranges from $186.01 to $201. That is a wide daily range, not tight consolidation. The stock finishes in the lower part of it. Volume is below the average of the preceding 50 sessions, but that alone does not establish buying interest.
After the large advance, I want to see a smaller range develop and later pullbacks attract buyers. The $172.94 area from issue 015 still holds. It is a review level, not a guaranteed floor.
CRWD advances without a strong volume increase
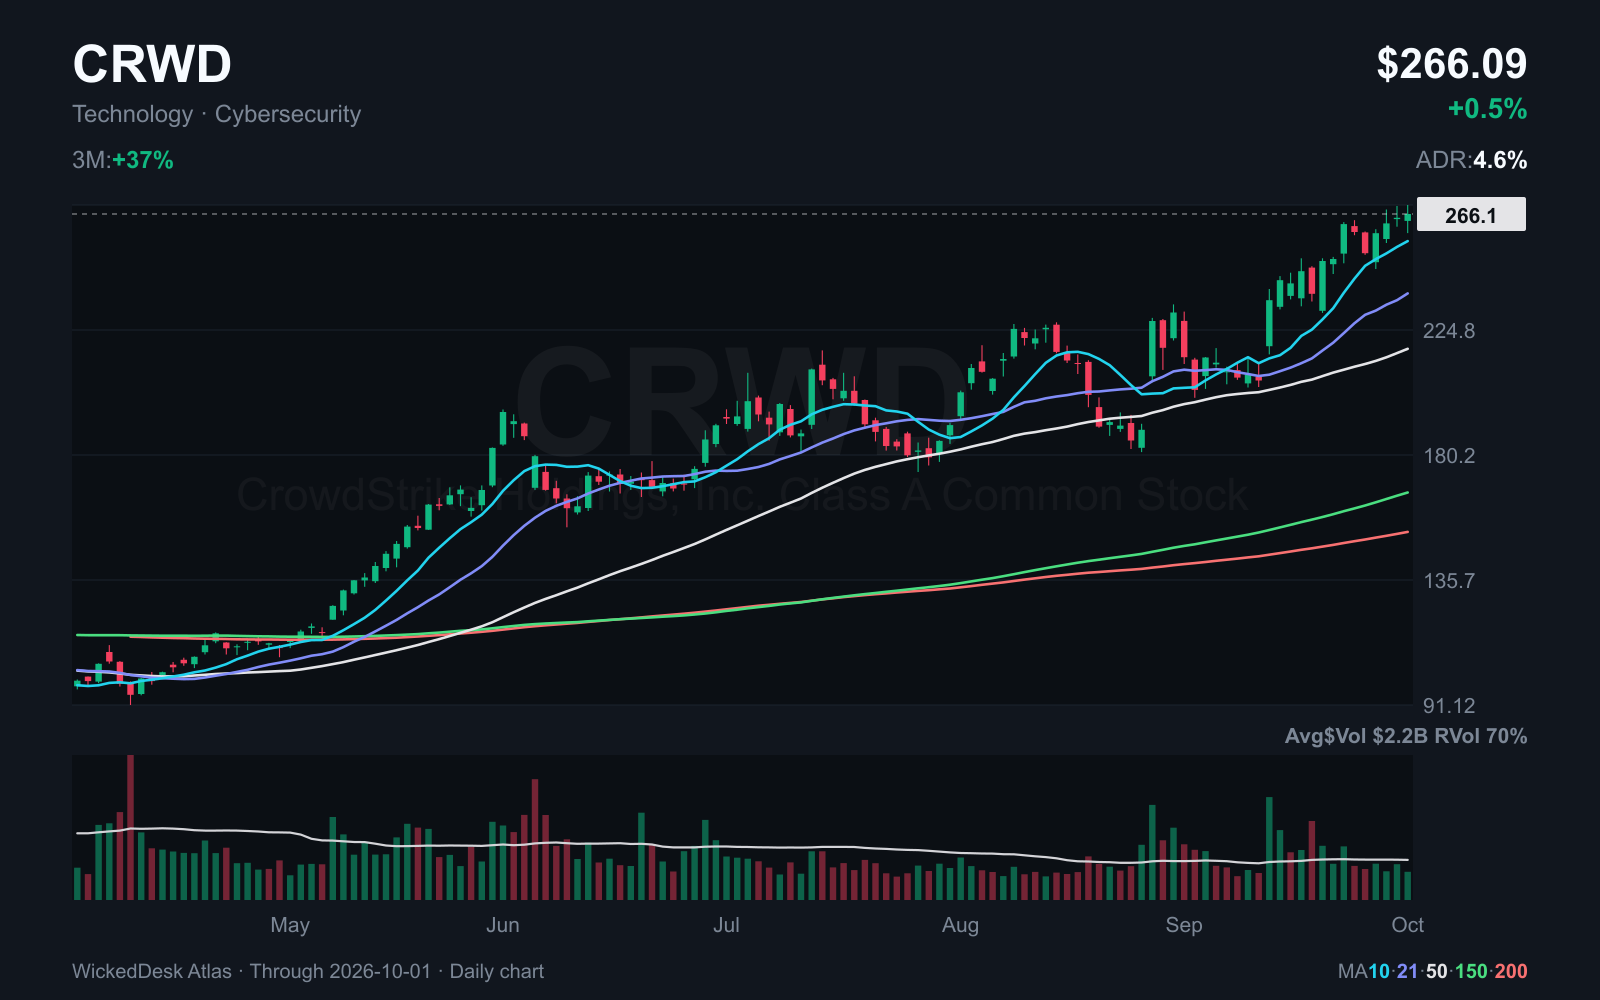
CRWD gains 5.5% from Friday through Thursday and closes at $266.09. SPY loses 1% over the same period. That is relative strength in a direct price comparison. Its 10 day average at $256.42 and the $248.51 area from issue 015 sit below the close.
Thursday’s advance comes on less volume than the average of the preceding 50 sessions. The green chart therefore does not establish forceful new buying. Alongside OKTA and PANW, CRWD still remains one of the better ongoing studies.
For a new entry, I want a defined range and a point where the idea fails. Chasing because the stock looks better than the index is something else.
Oil rises while gold and silver stay down for the week
From Friday through Thursday, gold ETF GLD loses 2.7% and silver ETF SLV 5.4%. Long Treasury ETF TLT falls 2%, while dollar ETF UUP gains 1.2%. Oil futures ETF USO rises 3% on Thursday, taking its gain against Friday to 1.1%.
These ETFs are proxies for their markets, not exact spot prices. An oil fund can behave differently from a quoted oil price because it holds futures.
Gold does not rise in every stressful week. Silver also responds to industrial demand. Combining gold, silver, Bitcoin and stocks does not mean they always hedge one another. A long term attractive asset can still fall alongside other holdings in the short term.
Buyers return to Bitcoin ETFs
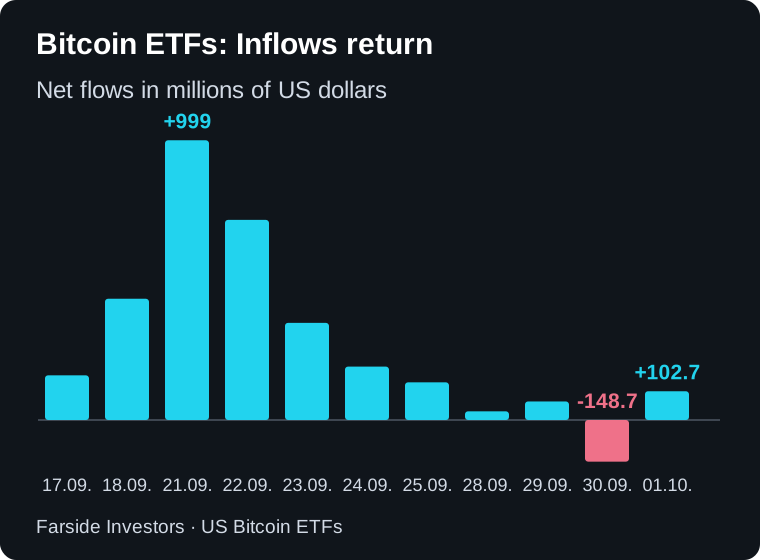
After nine inflow days totaling about $3.08 billion, US Bitcoin ETFs record $148.7 million of net outflows on Wednesday. Thursday brings $102.7 million of inflows. Monday through Thursday ends with $51.2 million of net inflows.
Buyers have not simply disappeared, but the pace is slower than in the preceding inflow streak. ETF flows capture only part of demand and do not establish Bitcoin’s next price.
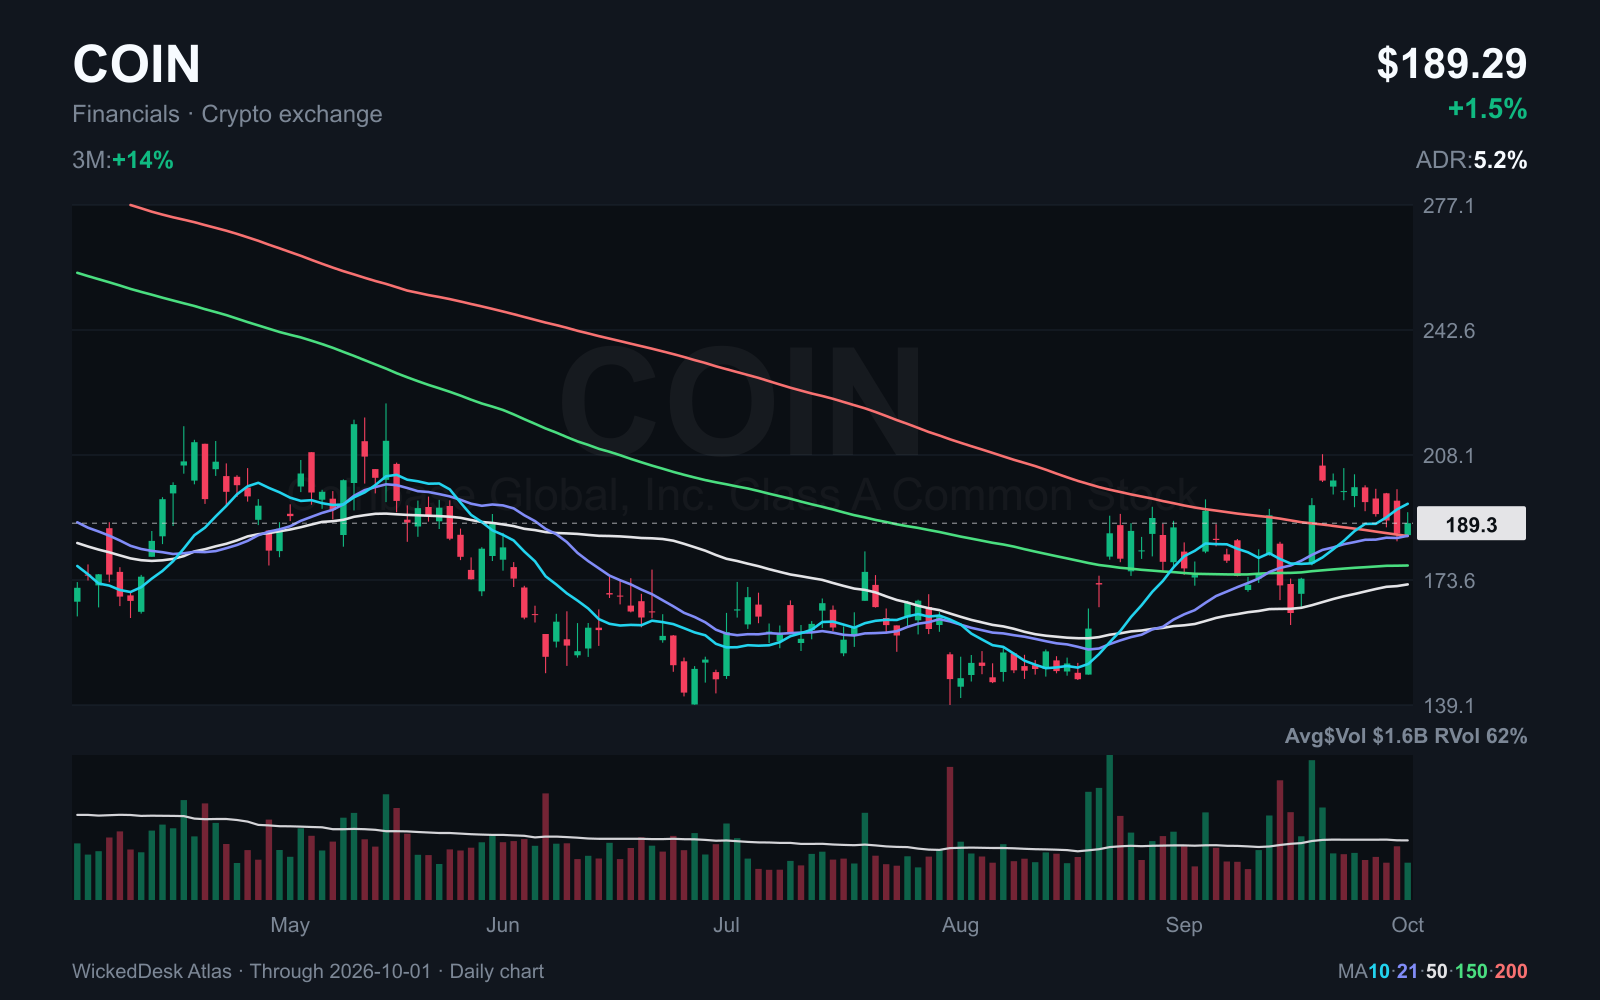
COIN is only about 2% above its 200 day SMA and remains below its 10 day average. Exchange operators and miners have their own costs, debt and business models. I would not transfer a better Bitcoin outlook to every crypto stock without checking.
COIN sits directly on its 200 day SMA
COIN closes Thursday at $189.29. Its 200 day SMA is $185.75. That is a very small gap. The stock also trades below the line during the same session.
A close slightly above the average passes the first filter but does not establish a durable reclaim. I would want several holding closes and better performance against the broad market. COIN loses 3.0% from Friday.
It remains an observation rather than belonging in the same category as the stronger Cybersecurity stocks. A close back below the 200 day SMA would remove it from this long review.
Not every interesting report belongs on the watchlist
COIN stays outside the narrower list because it is so close to its 200 day SMA. Carnival and Conagra illustrate costs and demand in this issue. They are not reviewed chart setups. NVIDIA’s repurchase authorization does not provide an entry point either.
Micron remains an event study. The conditions are straightforward: Observe the actual post earnings reaction first, then check whether it holds. The revenue guidance alone is not a reason to buy regardless of the chart.
Next week’s calendar
Monday brings the ISM US services report. After the increase in manufacturing input prices, prices and employment are especially relevant. On Tuesday, Marvell presents its plans at an investor day. This is not a quarterly earnings report.
Levi Strauss reports Wednesday and PepsiCo Thursday. Both can show how consumer prices and demand are developing. US gas storage follows on Thursday too. The next US consumer price release is October 14, not next week.
| Event | Day | Time | Question |
|---|---|---|---|
| ISM Services | Monday, October 5 | 16:00 CEST | Do prices and employment rise too? |
| Marvell investor day | Tuesday, October 6 | Morning in New York | How does data center planning develop? |
| Levi Strauss earnings | Wednesday, October 7 | Conference call 23:00 CEST | How do customers respond to pricing and product mix? |
| PepsiCo earnings | Thursday, October 8 | Results around 12:00, Q&A 14:15 CEST | Do higher prices or larger volumes drive sales? |
| US natural gas storage | Thursday, October 8 | 16:30 CEST | How much supply is available ahead of winter? |
- ISM Services
- Day
- Monday, October 5
- Time
- 16:00 CEST
- Question
- Do prices and employment rise too?
- Marvell investor day
- Day
- Tuesday, October 6
- Time
- Morning in New York
- Question
- How does data center planning develop?
- Levi Strauss earnings
- Day
- Wednesday, October 7
- Time
- Conference call 23:00 CEST
- Question
- How do customers respond to pricing and product mix?
- PepsiCo earnings
- Day
- Thursday, October 8
- Time
- Results around 12:00, Q&A 14:15 CEST
- Question
- Do higher prices or larger volumes drive sales?
- US natural gas storage
- Day
- Thursday, October 8
- Time
- 16:30 CEST
- Question
- How much supply is available ahead of winter?
What I will keep following next week
At Micron, I want to see whether Thursday’s buyers stay involved and the stock clears $1,105.50. CRWD, OKTA and TWLO show the better price performance so far. MRNA needs its wide range to become a tighter consolidation first.
The jobs report does not make next week straightforward. Employment barely grows while manufacturers report rising input prices. ISM Services can show whether that combination also appears beyond factories. PepsiCo and Levi Strauss add evidence on consumer spending.
For bonds, I want to see whether yields ease further and whether stocks respond with broader buying. For Bitcoin, I am watching whether Thursday’s ETF inflows continue. COIN needs more distance above its 200 day SMA first. Understand the market and news, compare groups, then review the individual chart. An interesting story is not a completed trade.