
What Friday changed
US stocks recovered on Friday, but the major index ETFs still finished the week lower. Energy held up better. Oil remained above $100 per barrel and the ten year Treasury yield came close to 5%.
The consumer price report shows why energy matters here. Gasoline became significantly more expensive in August. The ECB also raised interest rates this week. This issue looks at what that means for borrowing and the economy, how Oracle and Adobe traded after earnings, and what happened to the stocks on our previous watchlist.
Friday changed the picture at DELL. SNOW and COIN still have not reclaimed the levels they lost. That is why I keep coming back to earlier observations rather than moving on to a fresh set of names every week.
A Friday rebound, a losing week
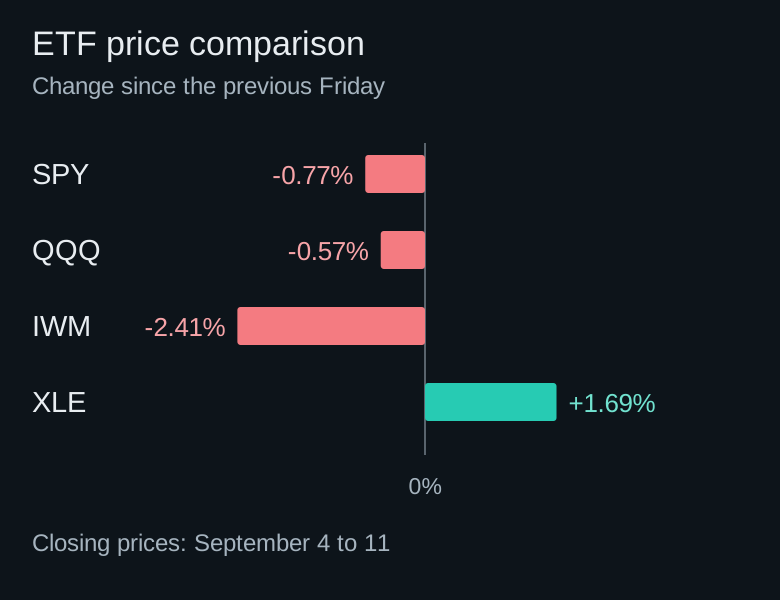
SPY gains +0.85% on Friday, QQQ +0.87% and IWM +0.41%. They still finish 0.77%, 0.57% and 2.41% below the previous weekly close. XLE, which tracks large US energy companies, gains +1.69% over the same week. The chart compares September 4 and September 11 closing prices, excluding distributions.
SPY and QQQ close back above their average price over the past 50 trading sessions. IWM remains below it. All three stay above their 200 day simple moving average, or SMA. Smaller stocks have participated less in the recovery. Next week I want to see whether they catch up and whether SPY and QQQ hold their 50 day averages.
The week’s main releases
The ECB raised its policy rates on Thursday. US producer prices were released that morning, followed by consumer prices on Friday. Oil pulled back into the weekly close but remained considerably more expensive than a week earlier.
Oracle and Adobe reported after Thursday’s regular session. Friday now gives us a complete trading session after the results. Oracle’s opening jump did not hold.
| Event | Day | Context |
|---|---|---|
| ECB | Thursday | All three policy rates rise by 0.25 percentage points |
| US producer prices | Thursday | +0.4% from July, +5.4% from a year earlier |
| US consumer prices | Friday | +0.4% from July, +3.4% from a year earlier |
| Oracle and Adobe after earnings | Friday | ORCL -1.74%, ADBE +1.37% in the regular session |
- ECB
- Day
- Thursday
- Context
- All three policy rates rise by 0.25 percentage points
- US producer prices
- Day
- Thursday
- Context
- +0.4% from July, +5.4% from a year earlier
- US consumer prices
- Day
- Friday
- Context
- +0.4% from July, +3.4% from a year earlier
- Oracle and Adobe after earnings
- Day
- Friday
Oil retreats but remains higher for the week
October WTI ends Friday at $100.05 per barrel and November Brent at $104.61. The contracts fall 2.37% and 2.81% from Thursday. DTN reports a weekly gain of roughly 9% for both.
Reports about talks on safe shipping routes helped prices retreat on Friday. They did not mean that the disruptions in the Middle East had been resolved.
A producer may benefit from higher selling prices. A refiner also needs the prices of gasoline and diesel to be considered against the cost of crude. Airlines and freight operators may face higher fuel bills. The effect on profits depends on hedging and on how much of the increase a company can pass on to customers.
European gas closes at €79.52
The nearby ICE TTF future listed by Investing.com closes Friday at €79.52 per megawatt hour, down from €82.047 on Thursday. That 3.08% decline reverses part of the recent rise. Compared with €71.952 the previous Friday, the contract is still about 10.5% higher.
TTF is a European gas benchmark. For US gas, we look at Henry Hub. Supply conditions and prices differ between the two markets. So do the units: euros per megawatt hour here, dollars per MMBtu in the US. Expensive European gas does not automatically mean higher selling prices for every US producer.
US gas prices fall
The Henry Hub spot price falls from $2.92 on September 4 to $2.81 per MMBtu on September 9. This is the price for near term physical delivery.
US storage holds 3,254 billion cubic feet for the week ending September 4. That is 4.8% above the five year average but 2.4% below the previous year. The weekly injection is 40 billion cubic feet.
Storage is therefore above its longer term average. For a US gas producer, these supply conditions and US prices are more useful starting points than the European price alone.
The ten year Treasury yield reaches 4.96%
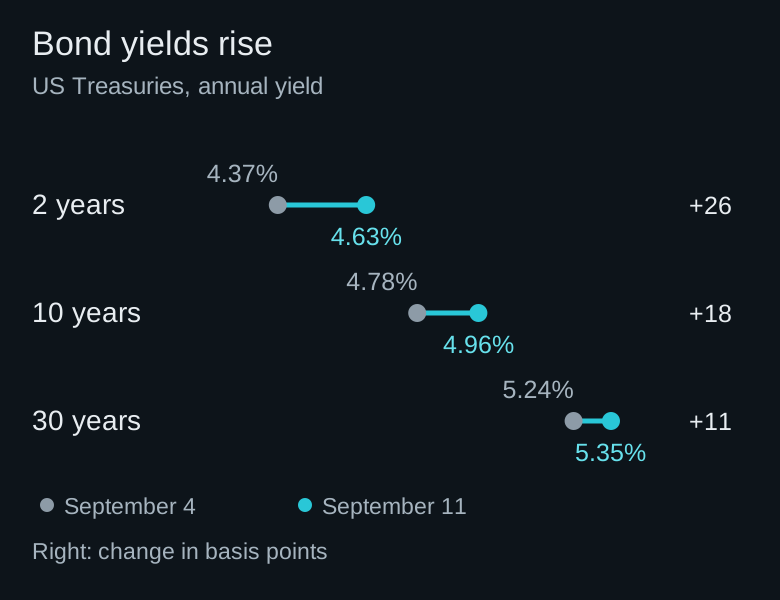
The ten year US Treasury yield rises from 4.78% the previous Friday to 4.96%. The two year yield reaches 4.63% and the thirty year yield 5.35%. The graphic compares the official Treasury yields. One hundred basis points equal one percentage point.
Friday does not bring a broad decline in yields. The two year and ten year rates edge higher than Thursday, while the thirty year yield slips slightly.
Higher market rates can initially mean price losses for existing fixed rate bonds. Newly issued bonds offer higher yields, making older, lower yielding bonds less attractive. Longer maturities often react more strongly. That price risk matters if you need to sell before maturity.
The ECB raises its deposit rate to 2.50%
On September 10, the ECB decides to raise all three key rates by 0.25 percentage points. The deposit rate moves from 2.25% to 2.50%, effective September 16. The ECB projects inflation of 3.0% and economic growth of 0.9% for 2026.
New loans and refinancing can become more expensive. A company then needs a higher return on an investment to cover its financing costs. A home purchase can become harder to finance too. Existing fixed rate loans do not become more expensive simply because the ECB raises rates. Savings accounts and term deposits may pay more, although each bank decides how much it passes on.
When households borrow less to spend and companies delay investment, demand weakens. That can ease price pressure while also weighing on orders and growth. The effect takes time. Higher rates do not create extra oil or gas supplies either. The ECB is trying to contain inflation while expensive energy is already putting pressure on the economy.
For the money supply, banks are an important part of the process. When a bank makes a loan and credits the borrower’s account, it creates deposit money. Repaying the principal removes that money. More expensive loans can therefore slow monetary growth. Whether the money supply actually shrinks also depends on new lending, repayments and other flows. A higher policy rate alone does not tell us the outcome.
Euro area broad money M3 grew 3.4% from a year earlier in July. M3 includes currency, bank deposits and certain short term financial instruments. Adjusted lending to nonfinancial companies grew 4.4%. These figures describe conditions before the September decision, not its effects.
For my stock research, this means looking at upcoming refinancing for heavily indebted companies and watching demand in construction and consumer businesses. A company with solid cash generation and little need for financing can be affected differently. I would not infer that every stock must fall because of this rate increase.
Gasoline pushes US consumer prices higher
US consumer prices rise 0.4% from July and 3.4% from a year earlier. Gasoline rises 3.9%, accounting for more than a third of the monthly increase. Excluding food and energy, prices rise 0.3% for the month and 2.4% for the year.
Thursday’s producer price report had shown a monthly rise of 0.4% and an annual increase of 5.4%. It measures prices at a different stage of the economy, not a second version of consumer inflation.
That leaves the Fed with a difficult combination ahead of its meeting. Higher interest rates cannot directly increase the supply of energy. At the same time, the central bank wants to keep those costs from feeding persistently into other prices. These figures alone do not tell us with certainty what the next rate decision will be.
What Changed The Weekly Plan
US consumer prices, August
US producer prices, August
Energy remains in first place
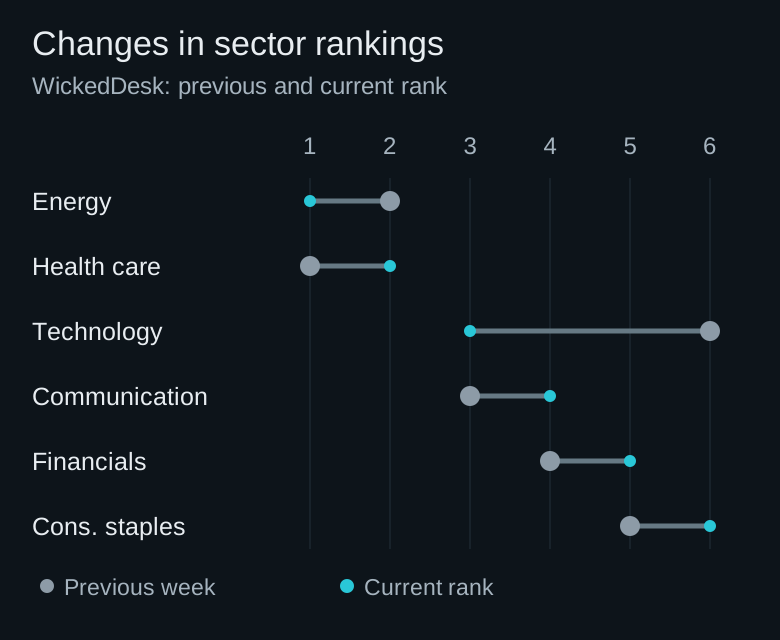
Energy leads WickedDesk’s sector ranking, ahead of health care. The median monthly return of the 87 tracked energy stocks is 8.63%. Some 78.2% of the stocks have gained over that period. The strength is therefore not coming from just one large company.
The table shows the current sector comparison after the completed trading week. The monthly median is the middle observation among the individual stock returns. It is neither XLE’s return nor the return of an investable portfolio.
| Sector | Rank | 1 month | Stocks higher | Stocks tracked |
|---|---|---|---|---|
| Energy | 1 | +8.63% | 78.2% | 87 |
| Health care | 2 | +1.83% | 57.7% | 213 |
| Technology | 3 | -0.05% | 49.7% | 286 |
| Communication | 4 | +0.39% | 51.3% | 39 |
| Financials | 5 | -1.53% | 36.8% | 193 |
| Consumer staples | 6 | -0.01% | 49.3% | 69 |
- Energy
- Rank
- 1
- 1 month
- +8.63%
- Stocks higher
- 78.2%
- Stocks tracked
- 87
- Health care
- Rank
- 2
- 1 month
- +1.83%
- Stocks higher
- 57.7%
- Stocks tracked
- 213
- Technology
- Rank
- 3
- 1 month
- -0.05%
- Stocks higher
- 49.7%
- Stocks tracked
- 286
- Communication
- Rank
- 4
- 1 month
- +0.39%
- Stocks higher
- 51.3%
- Stocks tracked
- 39
- Financials
- Rank
- 5
- 1 month
- -1.53%
- Stocks higher
- 36.8%
- Stocks tracked
- 193
- Consumer staples
- Rank
- 6
- 1 month
- -0.01%
- Stocks higher
- 49.3%
- Stocks tracked
- 69
Technology improves its relative position
Technology moves from sixth place last week to third. Energy rises from second to first and health care slips from first to second. Communication now ranks ahead of financials.
Technology’s median monthly return is still almost flat at minus 0.05%. Its better rank means other sectors have done worse. It does not, by itself, establish broad gains across technology stocks. I also look at individual charts and at the proportion of stocks that are higher.
CLMT and PBF stay near their yearly highs
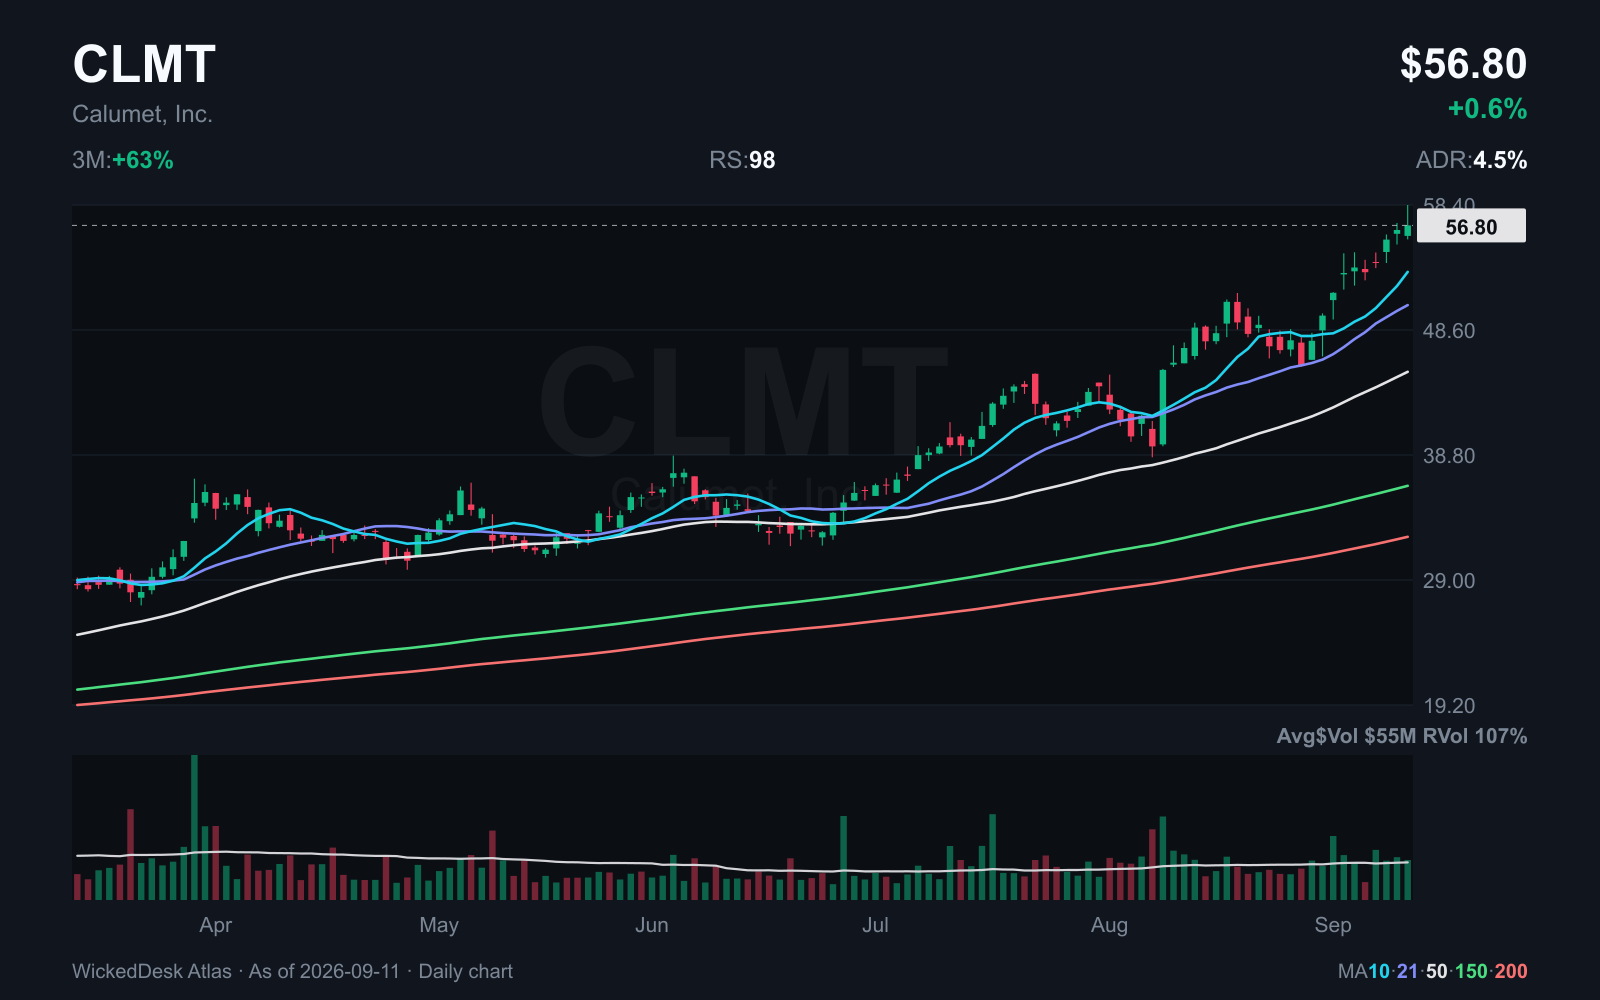
CLMT gains +6.91% for the week and PBF +5.33%. Both set new highs for the past 252 trading sessions on Friday, then give back part of the day’s advance. CLMT trades as high as $58.40 and closes at $56.80. PBF reaches $82.61 and closes at $78.30.
For refiners, I look beyond the price of oil. They buy crude and sell the products made from it. The difference between those prices, known as the crack spread, gives an indication of refining margins before other costs. More expensive crude does not automatically mean a higher profit.
US refinery utilization is 97.8% in the reporting week through September 4. Commercial crude inventories fall by 0.4 million barrels to 424.1 million. This is the latest published weekly inventory report, not a measurement from Friday.
Oracle gives up its opening jump after earnings
Oracle reports quarterly revenue of $19.3 billion, up 30% from a year earlier. Cloud infrastructure revenue grows 121% to $7.4 billion. Free cash flow for the quarter remains negative at roughly $5.4 billion.
The stock opens Friday +7.51% above the previous close. It still ends the day at $150.28, down 1.74%. Strong reported growth was not enough to keep the initial price jump intact.
Adobe reports $6.76 billion in revenue, up 13%. Its shares open lower but recover to $252.23, a daily gain of +1.37%. Both stocks remain below their 200 day SMA.
What Changed The Weekly Plan
Ether rebounds more strongly than Bitcoin
Bitcoin ends Friday at $77,208.55. That is +0.88% above the previous day, but 3.10% below the prior weekly close. Ether rises 3.24% on Friday to $2,516.29, leaving it higher for the week as well.
For both coins we use Coinbase Exchange daily closes in UTC, comparing September 4 with September 11. Crypto trades through the weekend, so these are completed Friday observations rather than live Saturday prices.
COIN also rises on Friday, but remains below its 200 day SMA. A recovery in a coin and the chart of a related stock are different things. COIN therefore stays outside our current stock selection.
| Week | Asset | Friday | Friday close |
|---|---|---|---|
| -3.10% | Bitcoin | +0.88% | $77,208.55 |
| +2.43% | Ether | +3.24% | $2,516.29 |
- -3.10%
- Asset
- Bitcoin
- Friday
- +0.88%
- Friday close
- $77,208.55
- +2.43%
- Asset
- Ether
- Friday
- +3.24%
- Friday close
- $2,516.29
On the watchlist: CLMT, PBF and DELL
CLMT, PBF and DELL still meet our selection rules: price above the 200 day SMA, an RS rating of at least 90, a gain of at least 20% over 63 trading sessions, ADR of at least 3%, and average daily dollar volume of at least $15 million. Each stock is less than 15% below its highest price of the past 252 sessions.
RS measures relative strength within the scanner universe. ADR is the average daily trading range over 20 sessions. For dollar volume, we average closing price multiplied by shares traded over 50 sessions.
DELL stands out. After Thursday’s decline, it gains almost 12% on Friday and finishes close to the day’s high. That is a different reaction from SNOW. It does not automatically make DELL a good entry after such a large move. I want to see whether a tighter trading range forms near the high. I am also waiting for consolidation in CLMT and PBF.
| Symbol | RS | ADR | Price | From high | 63 sessions | Avg dollar volume |
|---|---|---|---|---|---|---|
| CLMT | 98 | 4.5% | $56.80 | -2.74% | +62.66% | $54.7m |
| PBF | 98 | 5.4% | $78.30 | -5.22% | +90.37% | $199.2m |
| DELL | 99 | 6.2% | $567.29 | -0.08% | +44.92% | $3,408.1m |
- RS
- 98
- ADR
- 4.5%
- Price
- $56.80
- From high
- -2.74%
- 63 sessions
- +62.66%
- Avg dollar volume
- $54.7m
- RS
- 98
- ADR
- 5.4%
- Price
- $78.30
- From high
- -5.22%
- 63 sessions
- +90.37%
- Avg dollar volume
- $199.2m
- RS
- 99
- ADR
- 6.2%
- Price
- $567.29
- From high
- -0.08%
- 63 sessions
- +44.92%
- Avg dollar volume
- $3,408.1m
CLMT closes below its new high
CLMT reaches $58.40 on Friday and closes at $56.80. That is 2.74% below its highest price over the past 252 sessions. It is roughly 75% above its 200 day SMA.
The advance is clear. What interests me now is a consolidation over several days with smaller daily ranges. That could provide a level around which an entry and stop can be planned. The new high alone is not enough after this move.
SNOW remains below its earnings day low
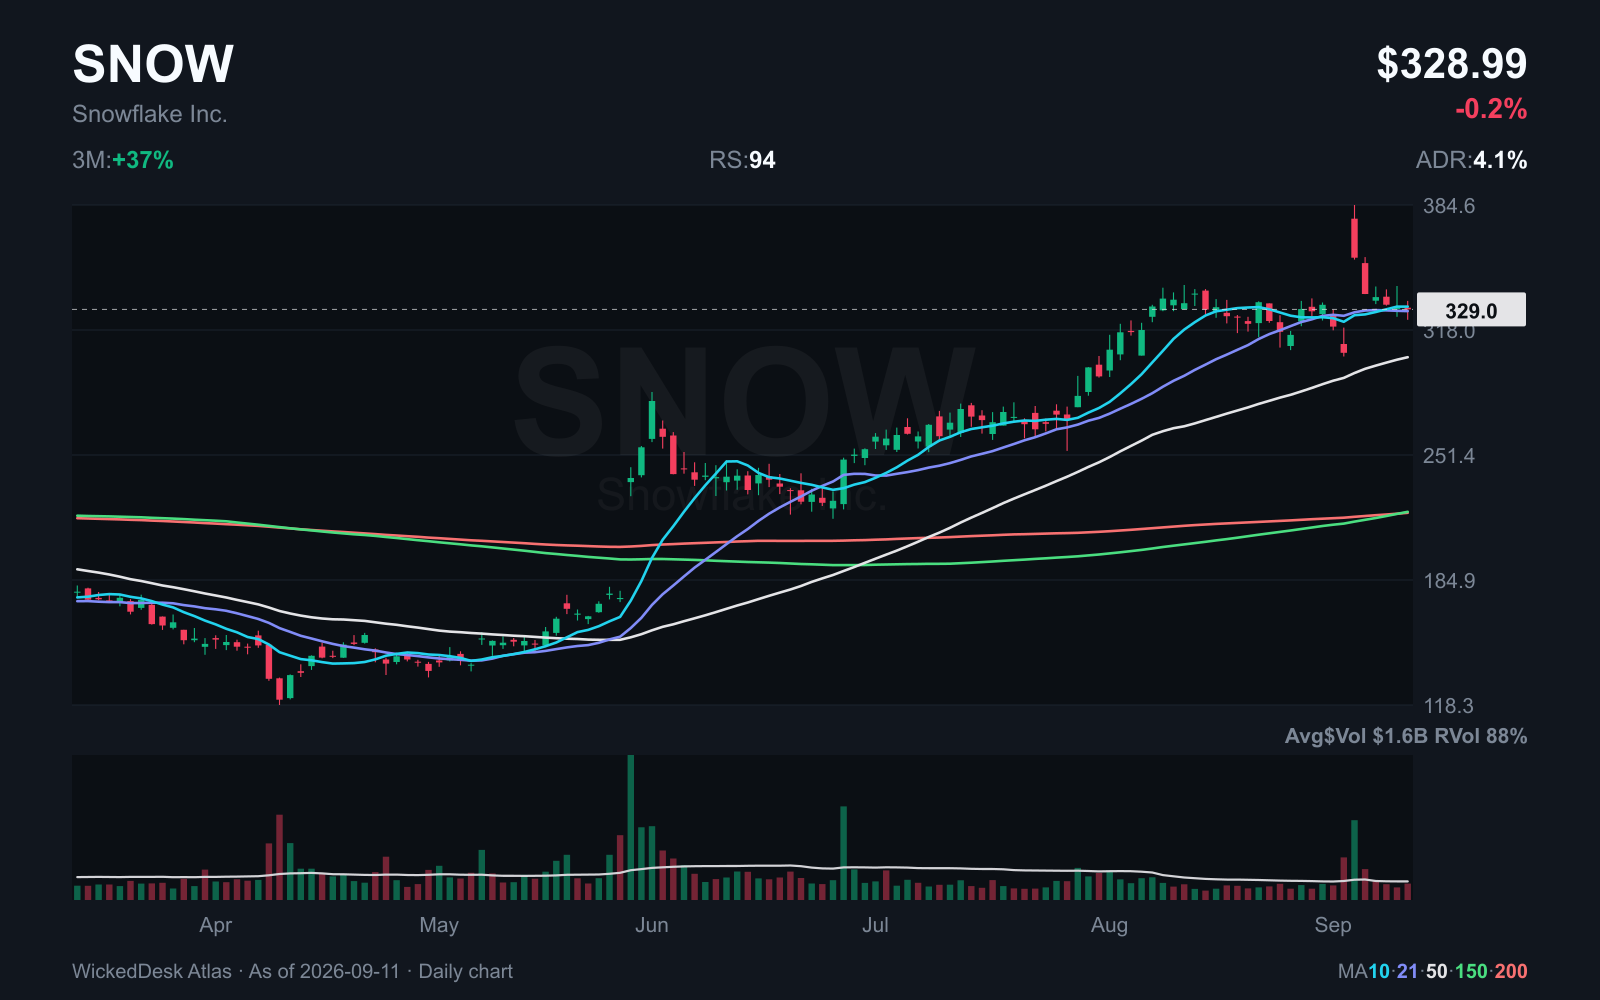
In the previous issue, we wanted to see whether SNOW could hold its earnings gap. The September 3 low was $355.47. Friday’s close at $328.99 remains below it.
The broader market’s rebound has not repaired that break. SNOW therefore does not return to the current watchlist. If a new base forms, it can be assessed on its own merits. The original observation stays in the record as one that failed.
COIN stays below its 200 day SMA
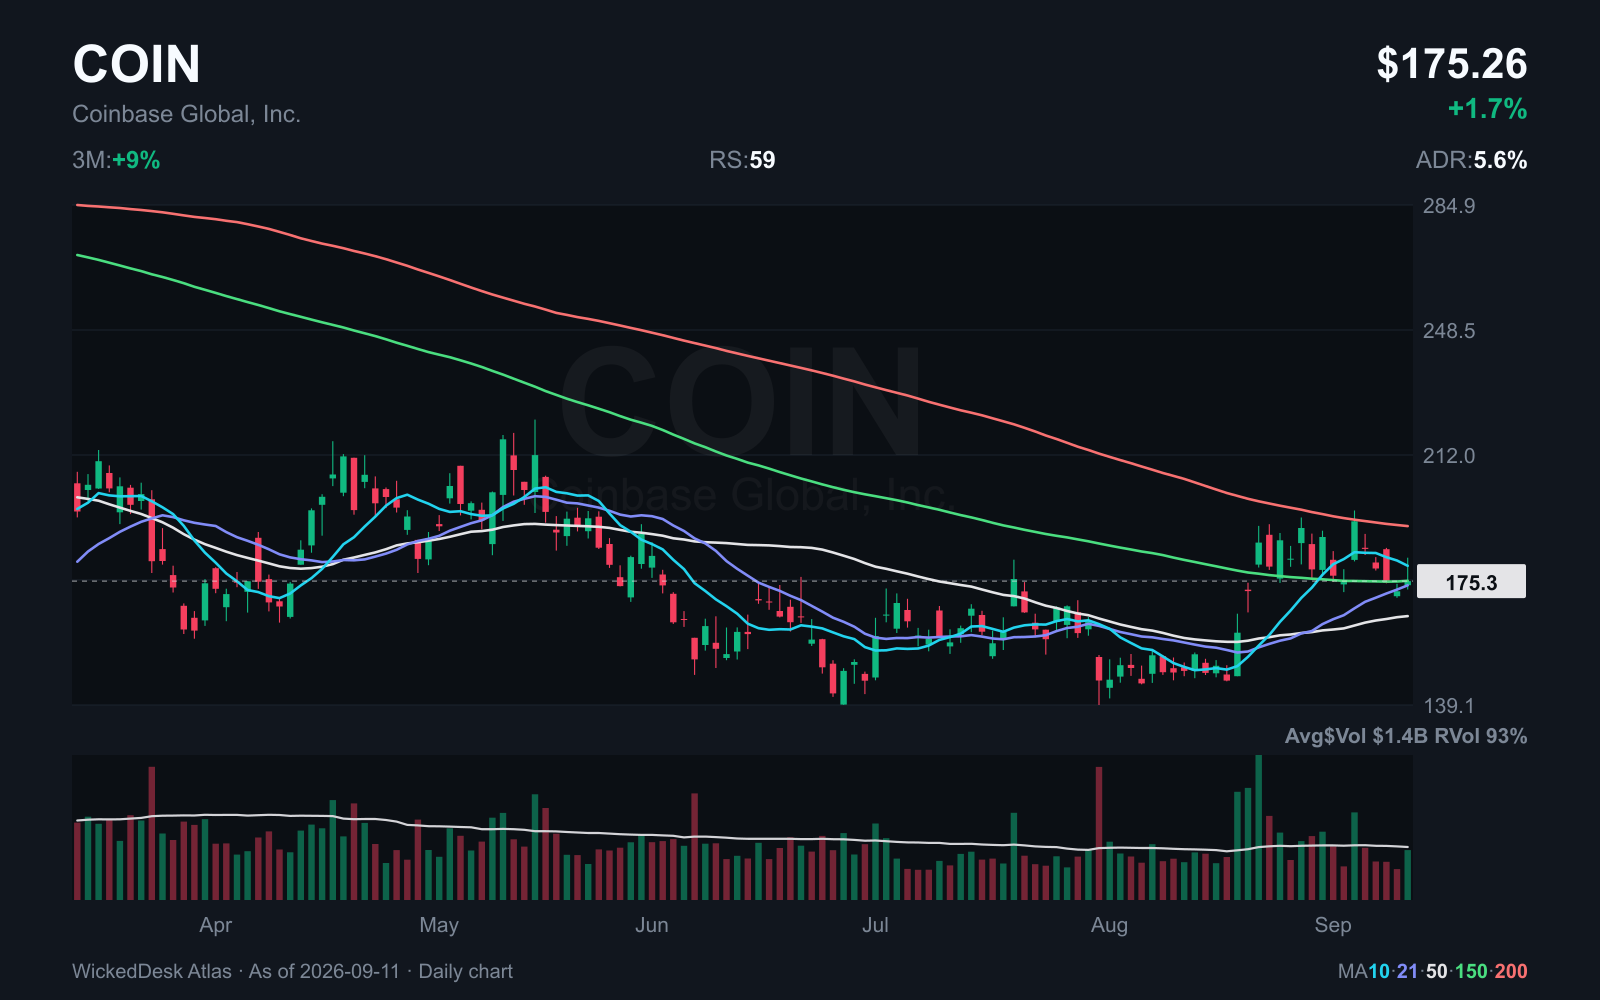
COIN gains +1.73% on Friday and closes at $175.26. Its 200 day SMA is $191.28. The recovery has not taken the stock back above that longer term average.
The red line in the chart is the 200 day SMA. While the stock remains below it, COIN does not meet our first selection rule. A better day for Bitcoin does not change that.
What happened to the previous watchlist
Issue 012, “Bitcoin is picking up,” discussed five stocks using prices from September 3. Here is where those observations stand after the next completed trading week.
SNOW and COIN lost the levels we were watching. DELL recovered sharply on Friday, but the tighter base we wanted is still missing. For HOOD and TEAM, we are also waiting to see whether a usable consolidation develops after their advances.
| Symbol | Now | Status | Previously |
|---|---|---|---|
| SNOW | $328.99, below the $355.47 low | Failed | Hold the earnings gap |
| DELL | $567.29, Friday +11.98% | Open | Base after the jump |
| HOOD | $112.57, week -7.81% | Open | Consolidate the advance |
| COIN | $175.26, below the $191.28 SMA | Failed | Hold the 200 day SMA |
| TEAM | $179.70, week -5.21% | Open | Wait for a later base |
- Now
- $328.99, below the $355.47 low
- Status
- Failed
- Previously
- Hold the earnings gap
- Now
- $567.29, Friday +11.98%
- Status
- Open
- Previously
- Base after the jump
- Now
- $112.57, week -7.81%
- Status
- Open
- Previously
- Consolidate the advance
- Now
- $175.26, below the $191.28 SMA
- Status
- Failed
- Previously
- Hold the 200 day SMA
- Now
- $179.70, week -5.21%
- Status
- Open
- Previously
- Wait for a later base
These stocks stay outside the selection
Oracle and Adobe remain below their 200 day SMA after the first complete session following earnings. Neither qualifies under our selection rule. Oracle also gives up its opening jump.
COIN remains below its longer term average as well. SNOW is different: it is above its 200 day SMA but has lost the earnings day low. Passing one filter does not replace checking the individual chart.
| Symbol | Close | Reason | 200 day SMA |
|---|---|---|---|
| COIN | $175.26 | Price below the 200 day SMA | $191.28 |
| ORCL | $150.28 | Price below the 200 day SMA | $167.64 |
| ADBE | $252.23 | Price below the 200 day SMA | $266.60 |
- Close
- $175.26
- Reason
- Price below the 200 day SMA
- 200 day SMA
- $191.28
- Close
- $150.28
- Reason
- Price below the 200 day SMA
- 200 day SMA
- $167.64
- Close
- $252.23
- Reason
- Price below the 200 day SMA
- 200 day SMA
- $266.60
Consider your combined portfolio risk
CLMT and PBF are both in energy. If you hold several stocks from the same sector, look at the combined position. News about oil prices or refining margins can affect several holdings at once.
Maturity matters for bonds. With stocks, debt and upcoming refinancing are worth checking, especially as rates rise. For a short term trade, I also need a planned exit if the price moves against me.
Position size can then be based on the intended loss between entry and stop. Fast moves or gaps can lead to a different execution price. That is also why upcoming earnings and major rate decisions belong in the preparation.
Next week: the Fed and US housing
The Fed releases its rate decision on Wednesday, September 16, at 2:00 p.m. New York time. The press conference follows at 2:30 p.m. After the inflation data and the rise in yields, I want to hear how the Fed assesses energy prices, demand and the rate outlook. I would not turn that into a fixed market forecast in advance.
Lennar reports after the US close on Wednesday. Its earnings call follows on Thursday at 11:00 a.m. New York time. New orders, cancellations and sales incentives should help show what more expensive financing is doing to the business. Revenue alone will not answer that. US industrial production follows on Friday at 9:15 a.m.
I am keeping CLMT, PBF and DELL on the watchlist. DELL has made another strong move, but I still want a tighter base before considering an entry. In energy, I want to see how much of the recent gains the stocks retain. SNOW and COIN need to reclaim the levels they lost first. SPY and QQQ should hold their 50 day averages. Smaller stocks joining in would be more convincing to me than another advance led by only a few large names.