
The Fed hikes. The market gets selective.
Within eight days the ECB, then the Fed and on Friday the Bank of Japan raised interest rates. That alone would fill a market week. A second pattern came with it: the broad market weakened into Wednesday and turned higher on Thursday with broad participation. On that day 727 stocks gained at least 4 percent and only 169 lost as much.
Against the September 11 close, SPY sits 0.22 percent lower through Thursday, QQQ 0.29 percent higher and IWM 1.20 percent lower. Only 36.2 percent of screened stocks trade above their 50 day line. At the same time genomics and cybersecurity lead the theme ranking. The market is not buying everything. It is choosing where to take risk. This issue follows that selection down to the individual chart. Friday's close and US industrial production were not yet available at the data cutoff.
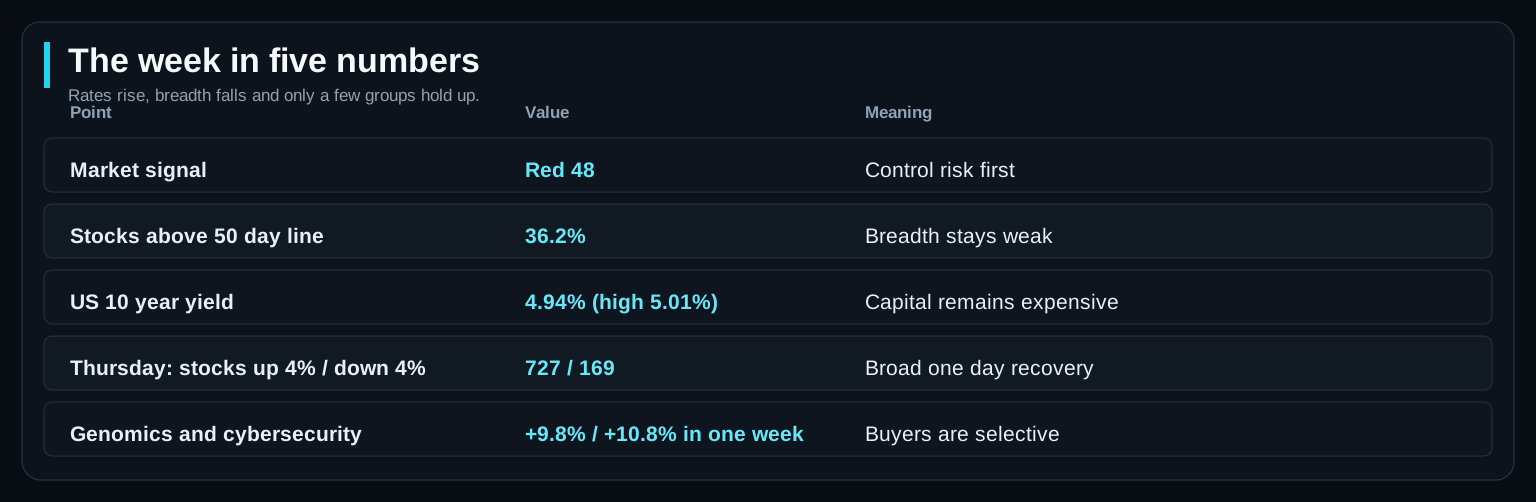
The week in five numbers
The WickedDesk market signal stands at Red 48. None of the three major index ETFs meets the short term trend conditions, even though SPY and QQQ reclaimed their 50 day lines on Thursday. The US 10 year yield reached 5.01 percent on Wednesday and sits at 4.94 percent on Thursday. Roughly one third of stocks trade above their 50 day line.
This is not a market where a rising index automatically means a healthy foundation. Thursday shows that buyers appear as soon as yields ease. New ideas still have to overcome expensive funding.
| Item | Value | Meaning |
|---|---|---|
| Market signal | Red 48 | Control risk first |
| Stocks above 50 day line | 36.2% | Breadth stays weak |
| US 10 year yield | 4.94% (high 5.01%) | Capital remains expensive |
| Thursday: stocks up 4% / down 4% | 727 / 169 | Broad one day recovery |
| Genomics and cybersecurity | +9.8% / +10.8% in one week | Buyers are selective |
- Market signal
- Value
- Red 48
- Meaning
- Control risk first
- Stocks above 50 day line
- Value
- 36.2%
- Meaning
- Breadth stays weak
- US 10 year yield
- Value
- 4.94% (high 5.01%)
- Meaning
- Capital remains expensive
- Thursday: stocks up 4% / down 4%
- Value
- 727 / 169
- Meaning
- Broad one day recovery
- Genomics and cybersecurity
- Value
- +9.8% / +10.8% in one week
- Meaning
- Buyers are selective
The Fed raises rates to 3.75 to 4 percent
On Wednesday the Federal Reserve raised its target range by 25 basis points to 3.75 to 4.00 percent. The vote was 12 to 0. The statement points to an economy expanding at a solid pace, resilient demand and inflation that remains elevated.
The move did not come during an economic boom. It came because demand and price pressure are still strong enough to leave the Fed little room. That is what makes the decision difficult for equities: the economy is holding up, but money is becoming more expensive.
Why the Fed hiked while stocks weakened
Consumer prices rose 0.4 percent in August and 3.4 percent from a year earlier. Gasoline gained 3.9 percent in the month. At the same time, retail sales increased 1.2 percent and stood 6 percent above the prior year.
The Fed is receiving two signals at once. Demand has not collapsed, but price pressure has not disappeared either. That makes rapid relief through lower rates less likely. Highly valued companies now need revenue, earnings and price action that genuinely justify the premium.
The projections move higher
The Fed now expects 2.3 percent real growth in 2026, unemployment at 4.1 percent and PCE inflation at 3.7 percent. Its median year end policy rate projection is 4.1 percent, up from 3.8 percent in June.
That is the sober message behind the press conference. The Fed sees enough growth to carry higher rates for longer. Investors should expect a market that rewards proven businesses and funds distant promises less generously.
The bond market believes the Fed and exhales on Thursday
The 10 year Treasury yield rose from 4.78 percent on September 4 to 4.96 percent on September 11 and 5.01 percent on Wednesday. On Thursday it eased to 4.94 percent. The 2 year yields 4.67 percent, the 30 year 5.29 percent. The inflation adjusted 10 year yield reached 2.68 percent on Wednesday and sits at 2.61 percent on Thursday.
That real yield matters for equities. The more investors can earn without taking company risk, the higher the hurdle for profits that may arrive years from now. Stocks turned higher on Thursday exactly when yields eased, which fits this picture. TLT, the long Treasury ETF, gained 1.11 percent on Thursday.
| Maturity | Thursday | Wednesday | Prior week |
|---|---|---|---|
| 2 year | 4.67% | 4.74% | 4.63% |
| 10 year | 4.94% | 5.01% | 4.96% |
| 30 year | 5.29% | 5.35% | 5.35% |
| 10 year real | 2.61% | 2.68% | 2.60% |
- 2 year
- Thursday
- 4.67%
- Wednesday
- 4.74%
- Prior week
- 4.63%
- 10 year
- Thursday
- 4.94%
- Wednesday
- 5.01%
- Prior week
- 4.96%
- 30 year
- Thursday
- 5.29%
- Wednesday
- 5.35%
- Prior week
- 5.35%
- 10 year real
- Thursday
- 2.61%
- Wednesday
- 2.68%
- Prior week
- 2.60%
Weaker into Wednesday, a broad rebound on Thursday
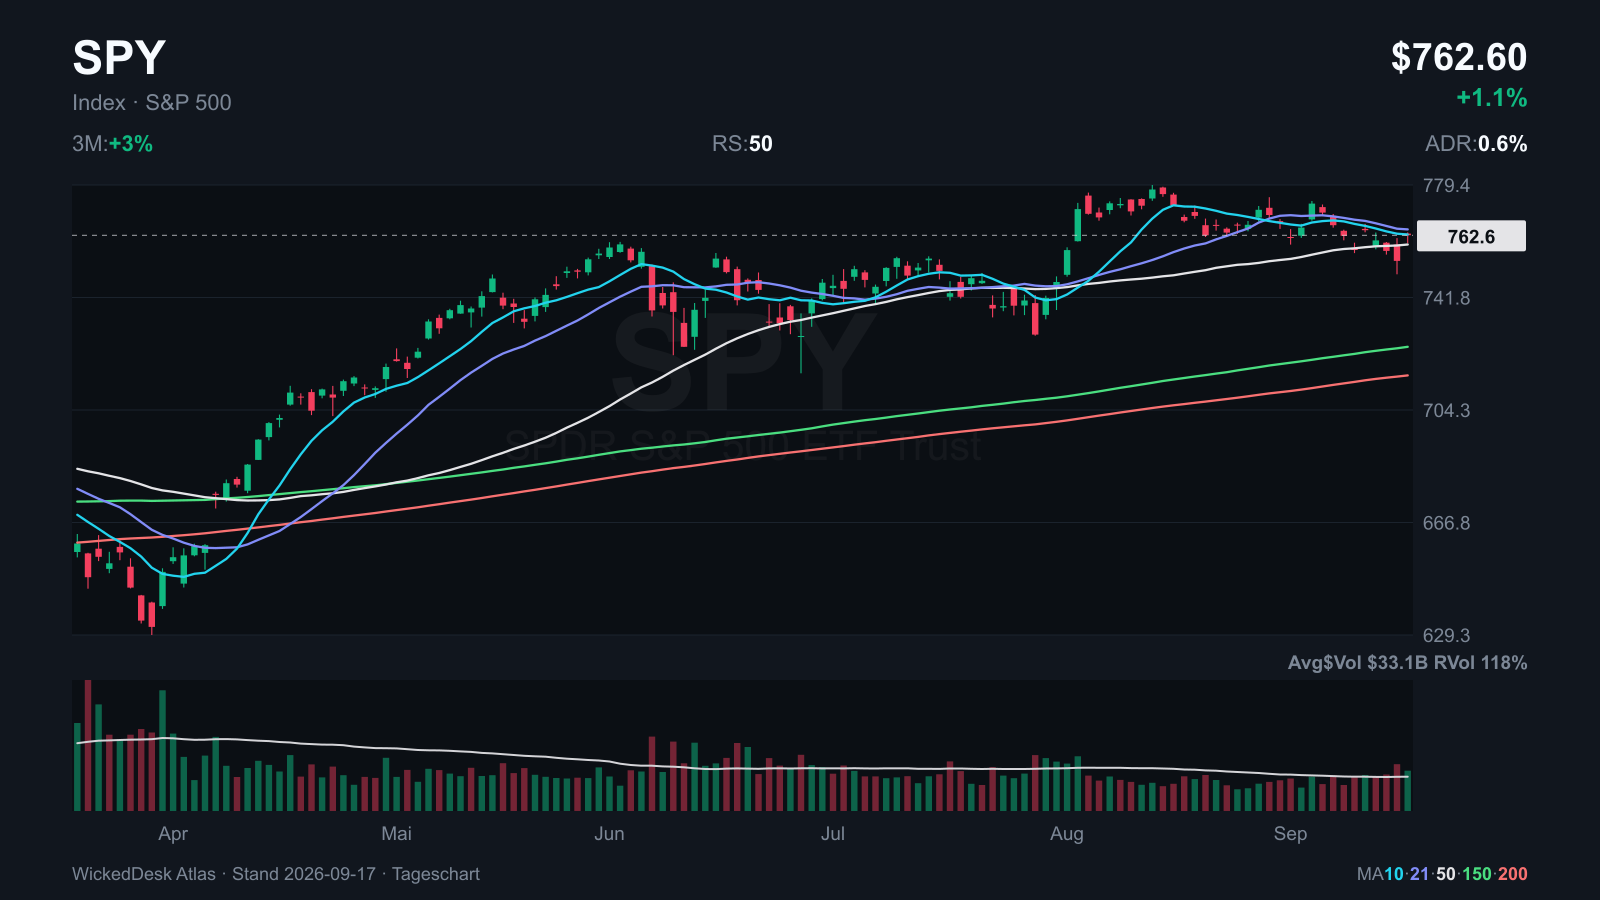
SPY fell from $764.29 on September 11 to $754.05 on Wednesday and gained 1.13 percent to $762.60 on Thursday. QQQ rose 1.73 percent to $716.92 on Thursday and sits slightly above its prior week close. IWM recovered only 0.53 percent and remains 1.20 percent lower for the week.
Small caps lagging the rebound fits the rate picture. Smaller companies are more sensitive to expensive funding. Next week hinges on whether SPY and QQQ hold their 50 day lines. Both closed just above them on Thursday, IWM remains below.
| Week | Market | Thursday | Close Sep 11 | Close Sep 17 |
|---|---|---|---|---|
| -0.22% | SPY | +1.13% | $764.29 | $762.60 |
| +0.29% | QQQ | +1.73% | $714.88 | $716.92 |
| -1.20% | IWM | +0.53% | $288.89 | $285.43 |
| +1.13% | TLT | +1.11% | $80.87 | $81.78 |
- -0.22%
- Market
- SPY
- Thursday
- +1.13%
- Close Sep 11
- $764.29
- Close Sep 17
- $762.60
- +0.29%
- Market
- QQQ
- Thursday
- +1.73%
- Close Sep 11
- $714.88
- Close Sep 17
- $716.92
- -1.20%
- Market
- IWM
- Thursday
- +0.53%
- Close Sep 11
- $288.89
- Close Sep 17
- $285.43
- +1.13%
- Market
- TLT
- Thursday
- +1.11%
- Close Sep 11
- $80.87
- Close Sep 17
- $81.78
The real problem is below the surface
Only 36.2 percent of screened stocks trade above their 50 day line. 215 stocks sit near a 52 week low, 185 near a 52 week high. Over one month, 1,051 stocks have lost at least 13 percent and 466 have gained at least 13 percent. That is the state of play before Thursday.
Thursday itself was different: 727 stocks gained at least 4 percent and 169 lost as much. One day does not repair breadth, but it shows buyers standing ready as soon as yields ease. A red market signal does not mean every stock must be sold. It means a stock has to earn its place on the watchlist.
Atlas: SPY reclaims the 50 day line, breadth is still missing
The daily chart shows the index losing momentum after its summer high. On Thursday SPY closes 0.4 percent above its 50 day average and 6.5 percent above its 200 day average. One green candle is not the key issue. The real question is whether the index stays above the 50 day line while the number of advancing stocks improves.
If breadth remains weak, every index bounce is more vulnerable. A week above the 50 day line together with more stocks above their own 50 day lines would improve the picture.
Money is getting more expensive outside the US too
The ECB raised its deposit rate to 2.50 percent on September 10. It cited additional inflation pressure from the Middle East conflict and now expects 3.0 percent inflation in 2026 with 0.9 percent growth. That is an uncomfortable mix for Europe.
The Bank of Japan followed on Friday. By a 7 to 2 vote it set the overnight call rate at around 1.25 percent, effective September 24. It cited high producer prices, expensive oil, a weak yen and wage increases feeding into consumer prices. Two board members wanted to wait. Three central banks moving the same way within eight days is the backdrop in which every growth valuation gets re-examined.
Health care leads, energy slips to second
After the week through Thursday, Health Care and Pharma ranks first in the WickedDesk sector ranking and Energy second. Over three months Health Care is up 16.8 percent and Energy 6.2 percent. Both lost ground for the week, Energy slightly more at 2.6 percent. Technology stays third, Communication moves ahead of Financials.
This shows the difference between a trend and a weekly move. A strong sector can pull back for a week. It becomes interesting where individual stocks reach new highs despite that decline. In energy those are the refiners, in health care the diagnostics and genomics names.
| Sector | Rank | Week | Leaders | 3 months |
|---|---|---|---|---|
| Health Care and Pharma | 1 (prior 2) | -2.3% | TXG, MRNA, IOVA, CDNA | +16.8% |
| Energy | 2 (prior 1) | -2.6% | CLMT, DK, CVI, PBF | +6.2% |
| Technology | 3 | -1.2% | DELL, QMCO, MXL, BLZE | +4.6% |
| Communication | 4 (prior 5) | -2.4% | ASST, ATEX, MGNI, ROKU | +5.1% |
| Financials | 5 (prior 4) | -2.8% | CHYM, HUT, BWIN, SLDE | +5.1% |
| Consumer Staples | 6 | -4.4% | CHEF, ELF, GO, DAR | -1.6% |
- Health Care and Pharma
- Rank
- 1 (prior 2)
- Week
- -2.3%
- 3 months
- +16.8%
- Energy
- Rank
- 2 (prior 1)
- Week
- -2.6%
- 3 months
- +6.2%
- Technology
- Rank
- 3
- Week
- -1.2%
- 3 months
- +4.6%
- Communication
- Rank
- 4 (prior 5)
- Week
- -2.4%
- 3 months
- +5.1%
- Financials
- Rank
- 5 (prior 4)
- Week
- -2.8%
- 3 months
- +5.1%
- Consumer Staples
- Rank
- 6
- Week
- -4.4%
- 3 months
- -1.6%
Genomics and cybersecurity swim against the market
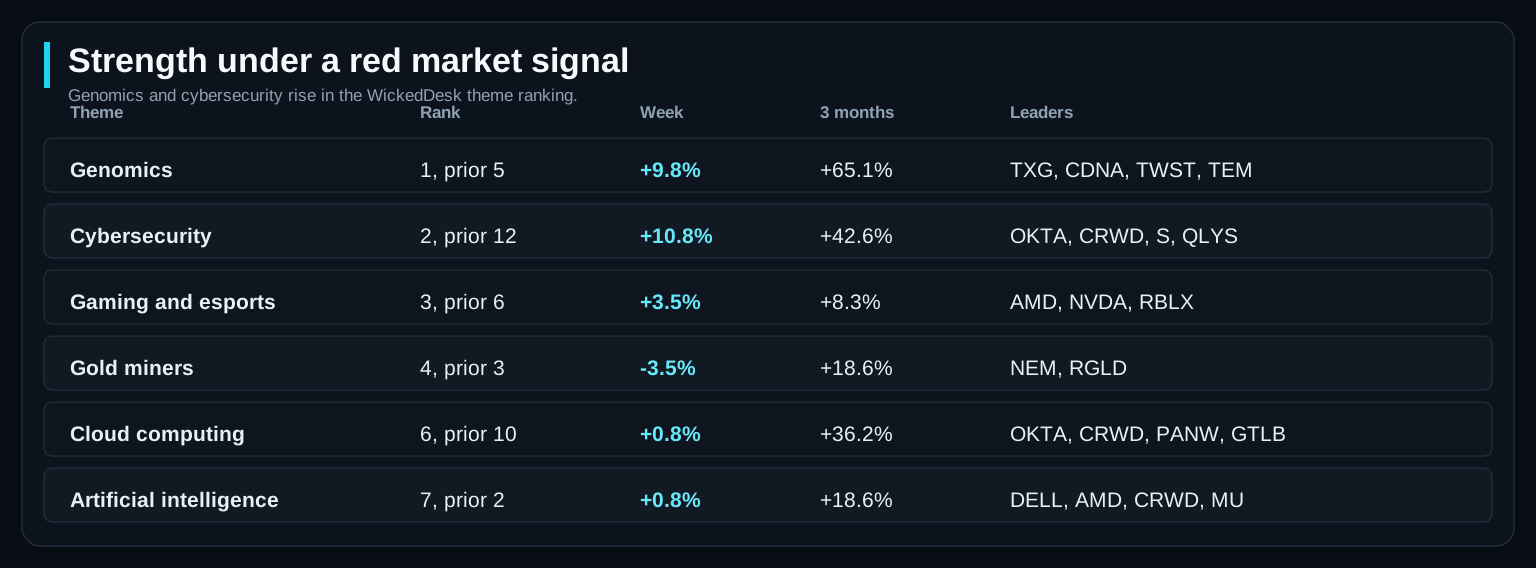
Genomics rises from fifth to first in the theme ranking. The basket gains 9.8 percent in one week and 65 percent over three months, seven of its eight names are up over one month. Cybersecurity jumps from twelfth to second and gains 10.8 percent in one week.
This is the most important observation in the issue. While broad participation deteriorates, money is flowing into clearly defined groups. Investors watching only SPY and QQQ will see that shift too late. Gold and silver miners, at the top a week ago, fall back for the week.
| Theme | Rank | Week | Leaders | 3 months |
|---|---|---|---|---|
| Genomics | 1, prior 5 | +9.8% | TXG, CDNA, TWST, TEM | +65.1% |
| Cybersecurity | 2, prior 12 | +10.8% | OKTA, CRWD, S, QLYS | +42.6% |
| Gaming and esports | 3, prior 6 | +3.5% | AMD, NVDA, RBLX | +8.3% |
| Gold miners | 4, prior 3 | -3.5% | NEM, RGLD | +18.6% |
| Cloud computing | 6, prior 10 | +0.8% | OKTA, CRWD, PANW, GTLB | +36.2% |
| Artificial intelligence | 7, prior 2 | +0.8% | DELL, AMD, CRWD, MU | +18.6% |
- Genomics
- Rank
- 1, prior 5
- Week
- +9.8%
- 3 months
- +65.1%
- Cybersecurity
- Rank
- 2, prior 12
- Week
- +10.8%
- 3 months
- +42.6%
- Gaming and esports
- Rank
- 3, prior 6
- Week
- +3.5%
- 3 months
- +8.3%
- Gold miners
- Rank
- 4, prior 3
- Week
- -3.5%
- 3 months
- +18.6%
- Cloud computing
- Rank
- 6, prior 10
- Week
- +0.8%
- 3 months
- +36.2%
- Artificial intelligence
- Rank
- 7, prior 2
- Week
- +0.8%
- 3 months
- +18.6%
Atlas: CDNA shows where strength is visible
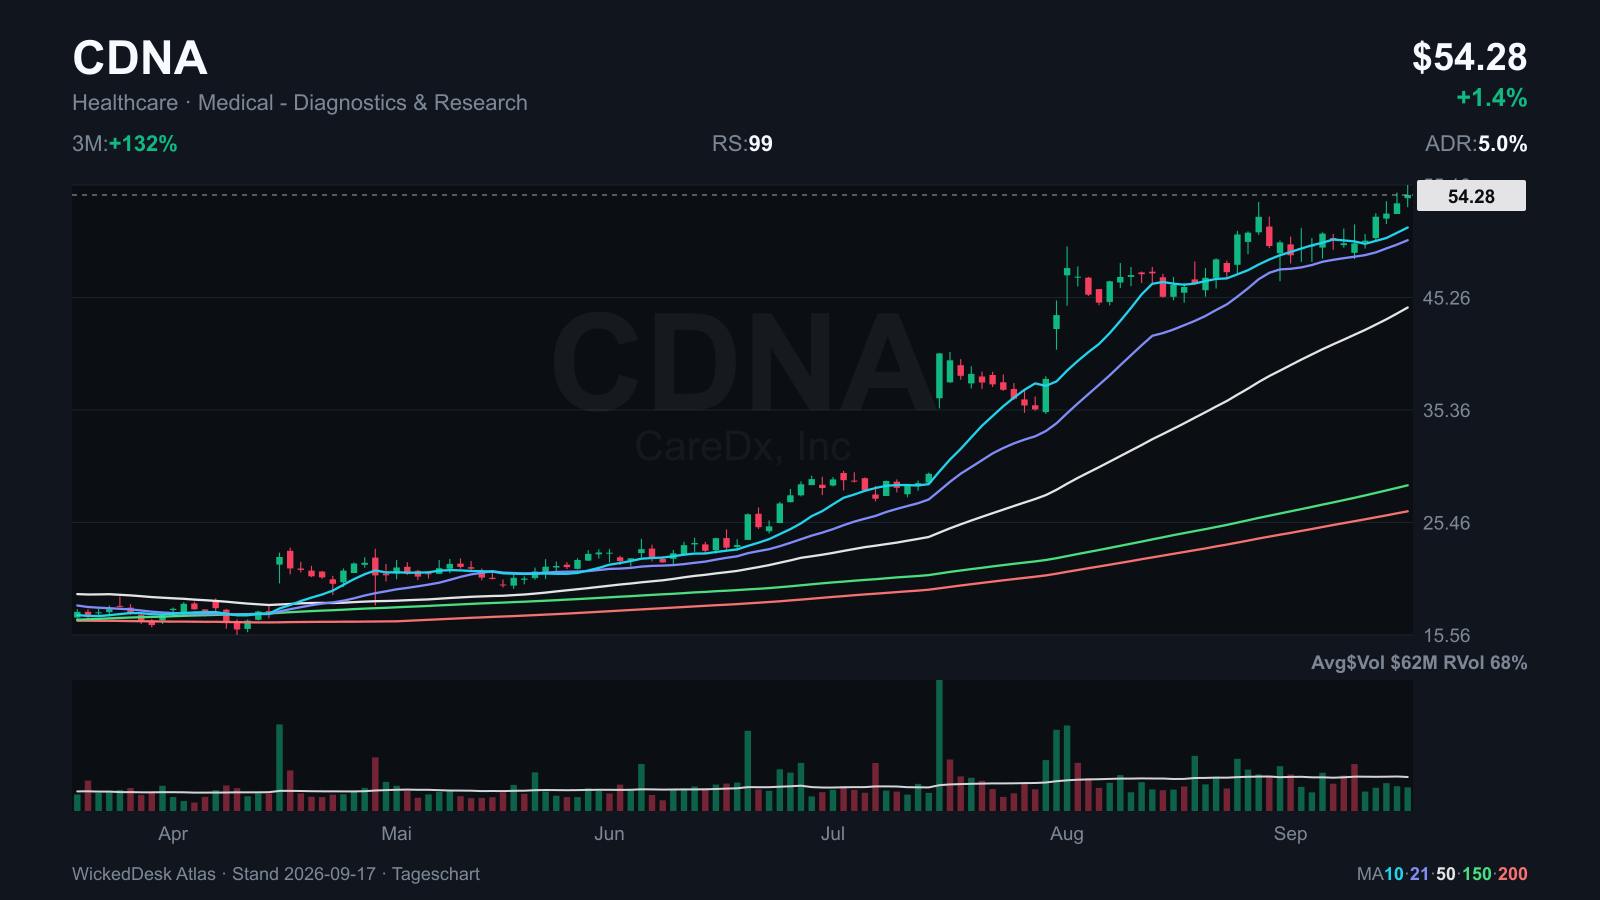
CareDx closes Thursday at $54.28, 1.6 percent below the high set the same day. The stock is up 131 percent over three months, carries RS 99 and trades above every major moving average. For the week it is up 8.0 percent.
That does not make CDNA an automatic buy. After such a run, the next test is whether a tight pause develops and the short averages hold. TWST and NTRA from the same group ran even harder this week. TWST moves 7.2 percent a day on average, which calls for a smaller position.
| Symbol | RS | ADR | Week | 3 months | From high |
|---|---|---|---|---|---|
| CDNA | 99 | 5.0% | +8.0% | +131% | -1.6% |
| TWST | 99 | 7.2% | +22.3% | +88% | -0.3% |
| NTRA | 97 | 3.2% | +11.4% | +62% | 0.0% |
| TXG | 99 | 6.2% | +18.5% | +145% | -1.6% |
- RS
- 99
- ADR
- 5.0%
- Week
- +8.0%
- 3 months
- +131%
- From high
- -1.6%
- RS
- 99
- ADR
- 7.2%
- Week
- +22.3%
- 3 months
- +88%
- From high
- -0.3%
- RS
- 97
- ADR
- 3.2%
- Week
- +11.4%
- 3 months
- +62%
- From high
- 0.0%
- RS
- 99
- ADR
- 6.2%
- Week
- +18.5%
- 3 months
- +145%
- From high
- -1.6%
Atlas: CRWD confirms cybersecurity strength
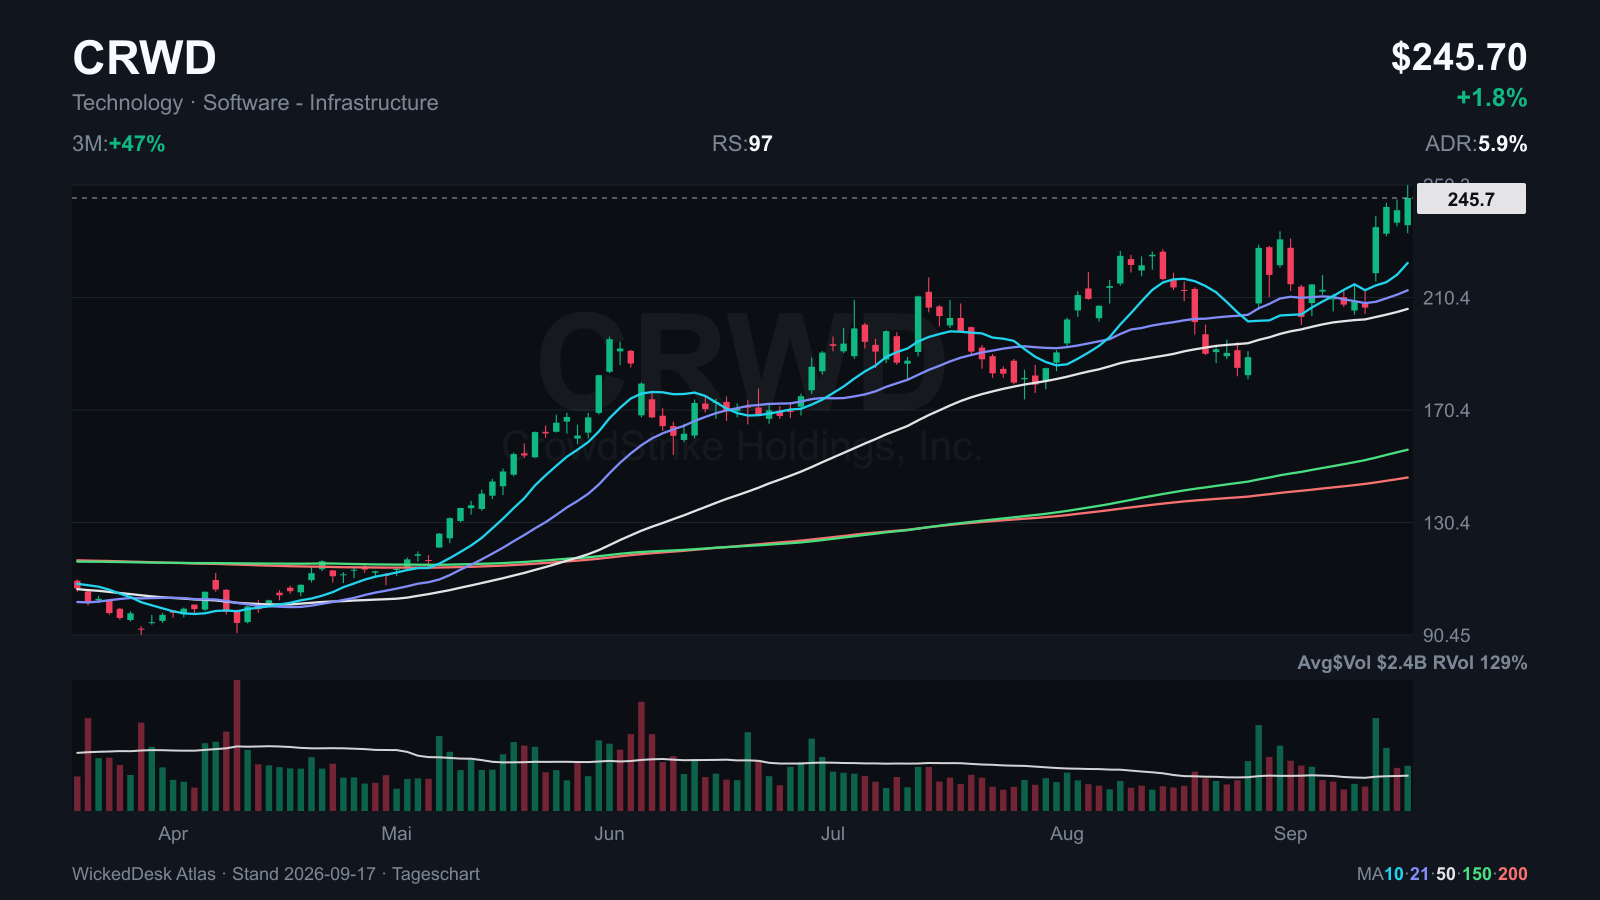
CrowdStrike gains 18.8 percent against its September 11 close and finishes Thursday at $245.70, 1.9 percent below the high set the same day. RS 97, price sits 18.6 percent above the 50 day average. After that quick run the stock is no longer at the beginning of the move.
The reaction that follows now matters more than the first green day. If CRWD holds the breakout and forms a tight pause, it confirms the group shift. OKTA, PANW and S move with it. PANW was the only one of the four to slip on Thursday and sits 5.1 percent below its high.
| Symbol | RS | ADR | Week | Thursday | From high |
|---|---|---|---|---|---|
| CRWD | 97 | 5.9% | +18.8% | +1.8% | -1.9% |
| OKTA | 98 | 5.2% | +14.1% | +1.0% | -0.2% |
| PANW | 96 | 5.2% | +13.4% | -0.2% | -5.1% |
| S | 92 | 4.6% | +17.4% | +0.1% | -3.9% |
- RS
- 97
- ADR
- 5.9%
- Week
- +18.8%
- Thursday
- +1.8%
- From high
- -1.9%
- RS
- 98
- ADR
- 5.2%
- Week
- +14.1%
- Thursday
- +1.0%
- From high
- -0.2%
- RS
- 96
- ADR
- 5.2%
- Week
- +13.4%
- Thursday
- -0.2%
- From high
- -5.1%
- RS
- 92
- ADR
- 4.6%
- Week
- +17.4%
- Thursday
- +0.1%
- From high
- -3.9%
Refiners remain the strongest corner of energy
CLMT gains 4.0 percent against its September 11 close and prints a new 252 day high at $59.30 on Thursday. CVI adds 9.0 percent, MPC 6.6 percent and DK sits at its high. PBF instead drops ten percent on Monday to $70.40 and recovers only part of that by Thursday. Strength is not spread evenly across the sector. It sits with individual refiners.
XLE, the ETF for large US energy companies, loses 1.0 percent for the week. The oil ETF USO is 0.3 percent above its prior week close and 18.9 percent above its level a month ago. Crude has already run hard. New positions in refiners need a proper consolidation and cannot depend on another rise in oil.
| Symbol | RS | Week | Status | 3 months | From high |
|---|---|---|---|---|---|
| CLMT | 99 | +4.0% | New high, wait for a pause | +78% | -0.4% |
| CVI | 98 | +9.0% | At the high | +96% | -0.1% |
| MPC | 97 | +6.6% | At the high | +73% | 0.0% |
| PBF | 98 | -1.5% | Needs a new base after the drop | +104% | -6.6% |
- RS
- 99
- Week
- +4.0%
- Status
- New high, wait for a pause
- 3 months
- +78%
- From high
- -0.4%
- RS
- 98
- Week
- +9.0%
- Status
- At the high
- 3 months
- +96%
- From high
- -0.1%
- RS
- 97
- Week
- +6.6%
- Status
- At the high
- 3 months
- +73%
- From high
- 0.0%
- RS
- 98
- Week
- -1.5%
- Status
- Needs a new base after the drop
- 3 months
- +104%
- From high
- -6.6%
MRVL: The post earnings gap is closing
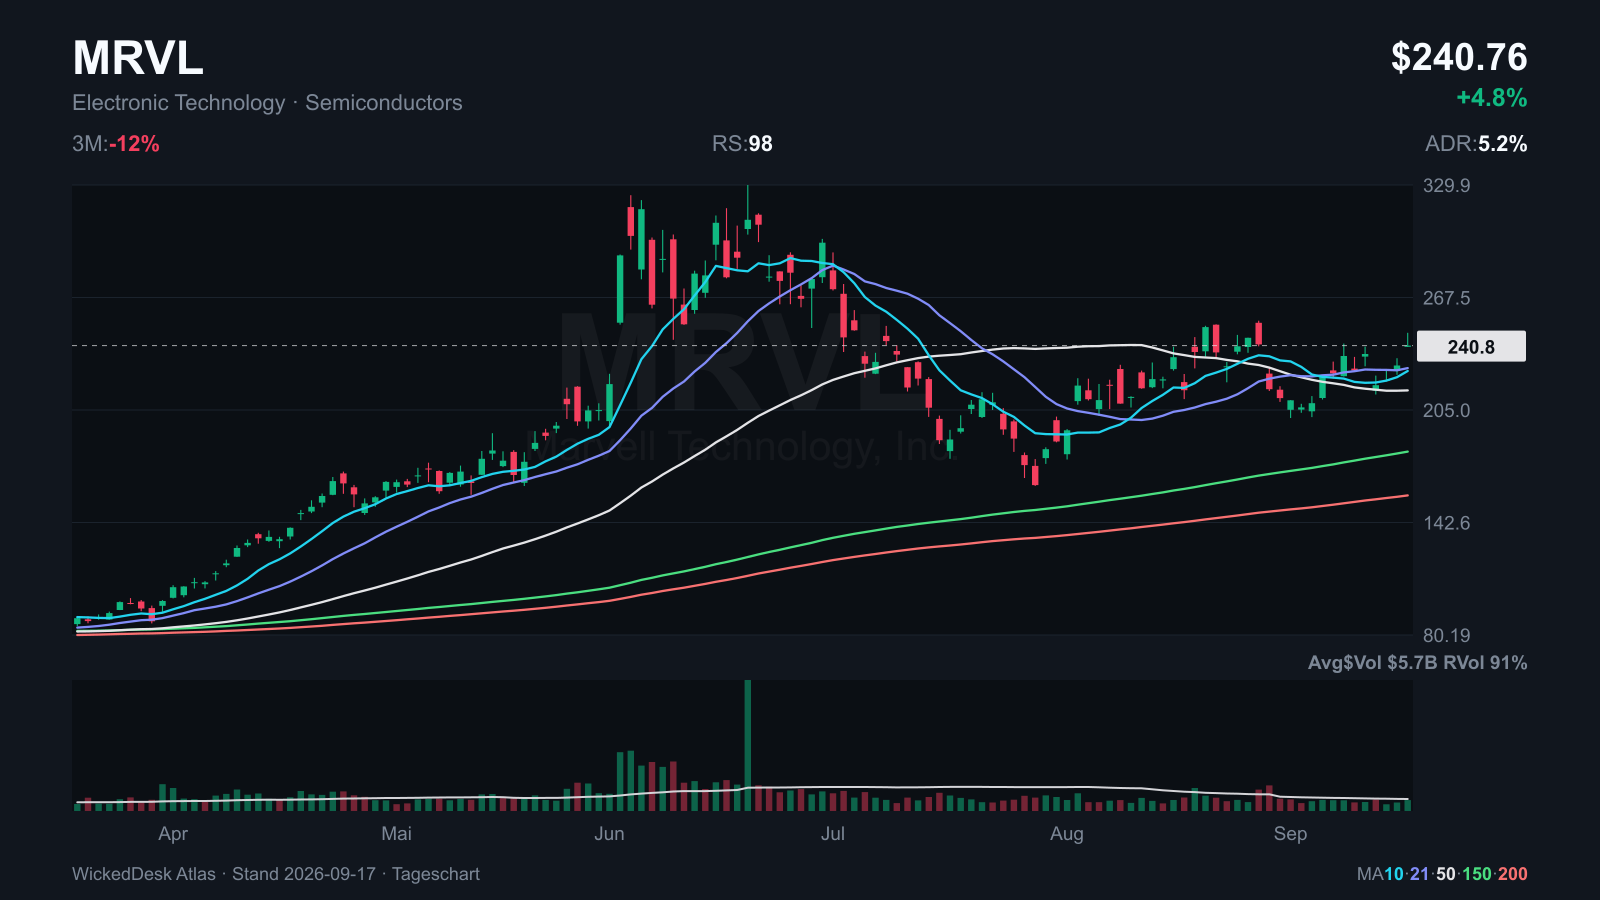
On August 27 Marvell reported a record quarter: revenue of $2.739 billion, up 37 percent from a year earlier, with data center revenue growing 46 percent. Non-GAAP earnings were $0.94 a share and the company guided to $3.15 billion of revenue for the current quarter. The stock still fell from $241.45 to $216.62 the next day and reached $200.62 on September 1.
Since then the price has closed that gap step by step. On Thursday MRVL gains 4.8 percent to $240.76 and trades back at its pre earnings level. Semiconductors rallied broadly that day, AMD gained 6.4 percent. That is the interesting setup: a record quarter, a completed wave of selling and a price 20 percent above the September low and 11 percent above the 50 day average.
Atlas: MRVL has reached its pre earnings close, volume decides next
The daily chart shows the June high at $329.88, the correction into early September and the recovery back to the $236 to $241 zone where the stock turned before earnings and again on September 11. RS 98, the average daily range is 5.2 percent. Price sits 27 percent below the June high and above every moving average.
Thursday traded 21 million shares, below the 50 day average. A breakout above $248, Thursday's high, on clearly higher volume would be the confirmation. A drop back below $229, Wednesday's close, would mark it as just another attempt inside the range. The investor day on October 6 is the next date where expectations can shift.
MRNA: The August catalyst gets its base
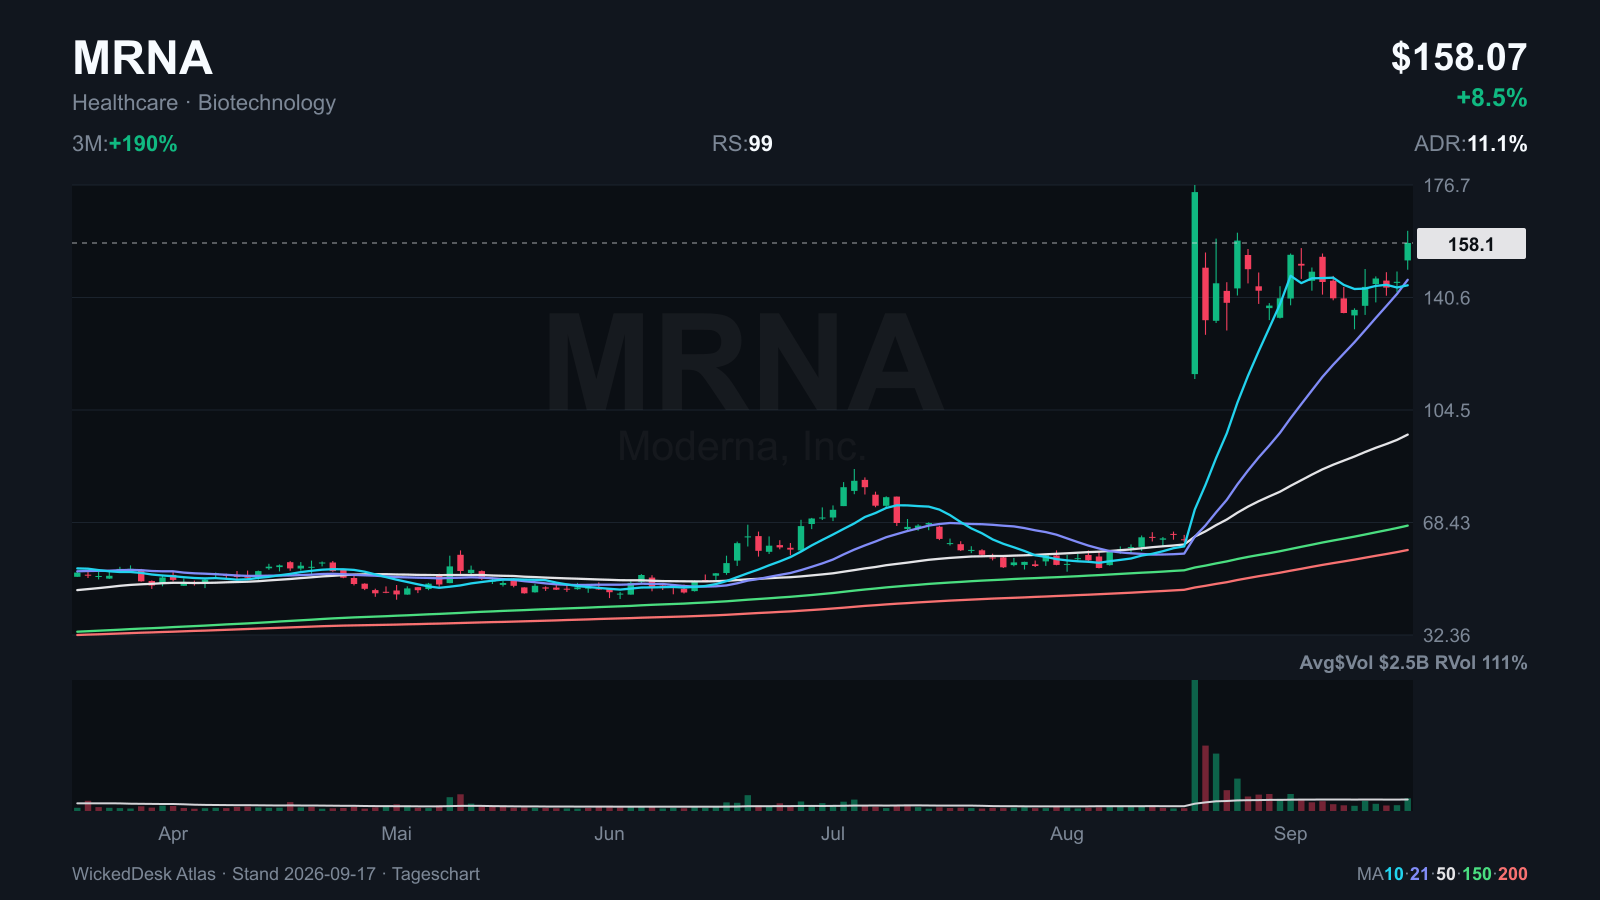
On August 19 MRNA jumped from $62.96 to $174.38 in one session after initial Phase 3 data on its mRNA cancer therapy for melanoma with Merck. In issue 010 we called that a genuine catalyst but explicitly not an entry: the jump was too large and the stock too far from its high. The condition was a tight base after the pullback.
That base has now formed. For four weeks the stock oscillated between $130.38 and $161.37 while daily volume fell from more than 100 million to 8 to 11 million shares. On Thursday MRNA gains 8.55 percent to $158.07 on 19 million shares. The day's high of $161.96 is the highest since August 19. There was no new company announcement; the filing index shows nothing since September 1.
Atlas: MRNA needs a close above $159
The chart shows the base since August 20: falling volume, rising 10 and 21 day lines, the 50 day average far below at $96.62. Thursday's close sits just under the base's highest close of $158.83 from August 25. The August 19 high at $176.66 is 10.5 percent away. RS 99, up 190 percent over three months.
A daily close above $159 on more than 20 million shares would be the breakout from the base. The average daily range of 11 percent is the risk in this stock: a normal position size here carries twice the risk of an ordinary candidate. A drop back below $149.50, Thursday's low, would leave the base open and mark the attempt as early. The next earnings report is scheduled for November 5.
Lennar shows what high rates do to the real economy
Lennar reported third quarter earnings of $1.19 a share, down from $2.29 a year ago. Orders fell 9 percent and deliveries declined 3 percent. Revenue was $8.0 billion and gross margin was 15.8 percent. The company describes incentives of roughly twelve percent to sustain volume.
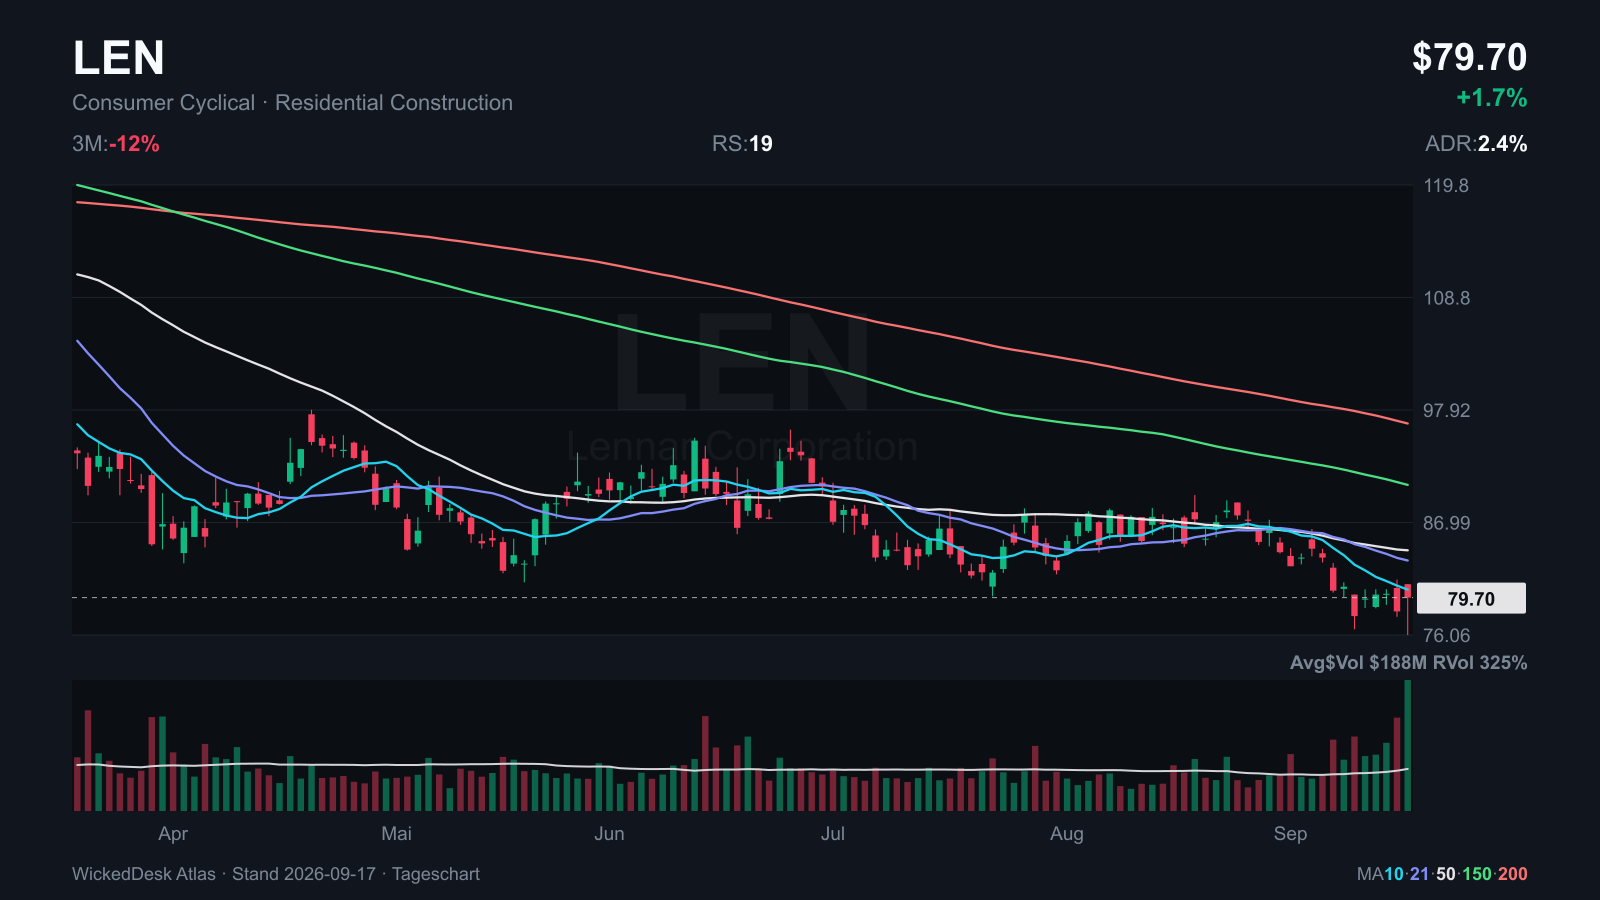
The Atlas chart agrees. LEN is below every major moving average, its RS is 19 and price sits 44 percent below the 52 week high. On Thursday the stock recovers 1.7 percent to $79.70 after a low of $76.06 the same day. A recovery above the 50 day line would weaken the bearish interpretation. The stock is far from that point.
Trip.com grows despite energy and geopolitical pressure
Trip.com increased quarterly revenue by 6 percent to $2.3 billion. International platform revenue grew about 50 percent and inbound travel grew at a high double digit rate. Adjusted earnings were $1.07 a share.
The company cited higher energy costs and geopolitical volatility as headwinds. That creates a useful contrast with Lennar. Both face a more difficult backdrop, but international travel demand is holding up better than rate sensitive US housing.
Dollar firm, gold pausing, oil still high
The UUP dollar ETF gains 1.1 percent against its September 11 close. The GLD gold ETF is flat for the week after a 1.7 percent gain on Thursday. USO gains 0.3 percent for the week and 18.9 percent over one month. XLE loses 1.0 percent.
That mix fits higher rates. The dollar benefits, gold struggles with higher real yields and oil remains an inflation factor of its own. This is not an invitation to chase oil. It is a reason to wait for the next base.
| Week | Asset | Month | Thursday |
|---|---|---|---|
| +1.1% | UUP (US dollar) | +0.9% | -0.1% |
| -0.1% | GLD (gold) | -0.1% | +1.7% |
| +0.3% | USO (oil) | +18.9% | -0.6% |
| -1.0% | XLE (energy stocks) | +1.3% | +0.7% |
- +1.1%
- Asset
- UUP (US dollar)
- Month
- +0.9%
- Thursday
- -0.1%
- -0.1%
- Asset
- GLD (gold)
- Month
- -0.1%
- Thursday
- +1.7%
- +0.3%
- Asset
- USO (oil)
- Month
- +18.9%
- Thursday
- -0.6%
- -1.0%
- Asset
- XLE (energy stocks)
- Month
- +1.3%
- Thursday
- +0.7%
Bitcoin is holding better than many risk assets, but confirmation is missing
Bitcoin ends Thursday at $76,417, 1.05 percent below its September 11 close and 18 percent above its level a month ago. Ether closes at $2,447, 2.75 percent lower than a week ago and 28 percent higher than a month ago. Both figures are completed UTC daily candles of the spot market; the running Friday is excluded.
Neither market has given up its intermediate advance. In the short term, follow through is missing. COIN still trades below its 200 day average with RS 44, HOOD lost 2.5 percent for the week. Crypto equities need Bitcoin to regain strength and liquid names to confirm the move. Bitcoin rising alone is not enough.
| Week | Asset | Close | Month | Thursday |
|---|---|---|---|---|
| -1.05% | Bitcoin | $76,417 | +18.1% | +0.28% |
| -2.75% | Ether | $2,447 | +27.6% | +1.20% |
- -1.05%
- Asset
- Bitcoin
- Close
- $76,417
- Month
- +18.1%
- Thursday
- +0.28%
- -2.75%
- Asset
- Ether
- Close
- $2,447
- Month
- +27.6%
- Thursday
- +1.20%
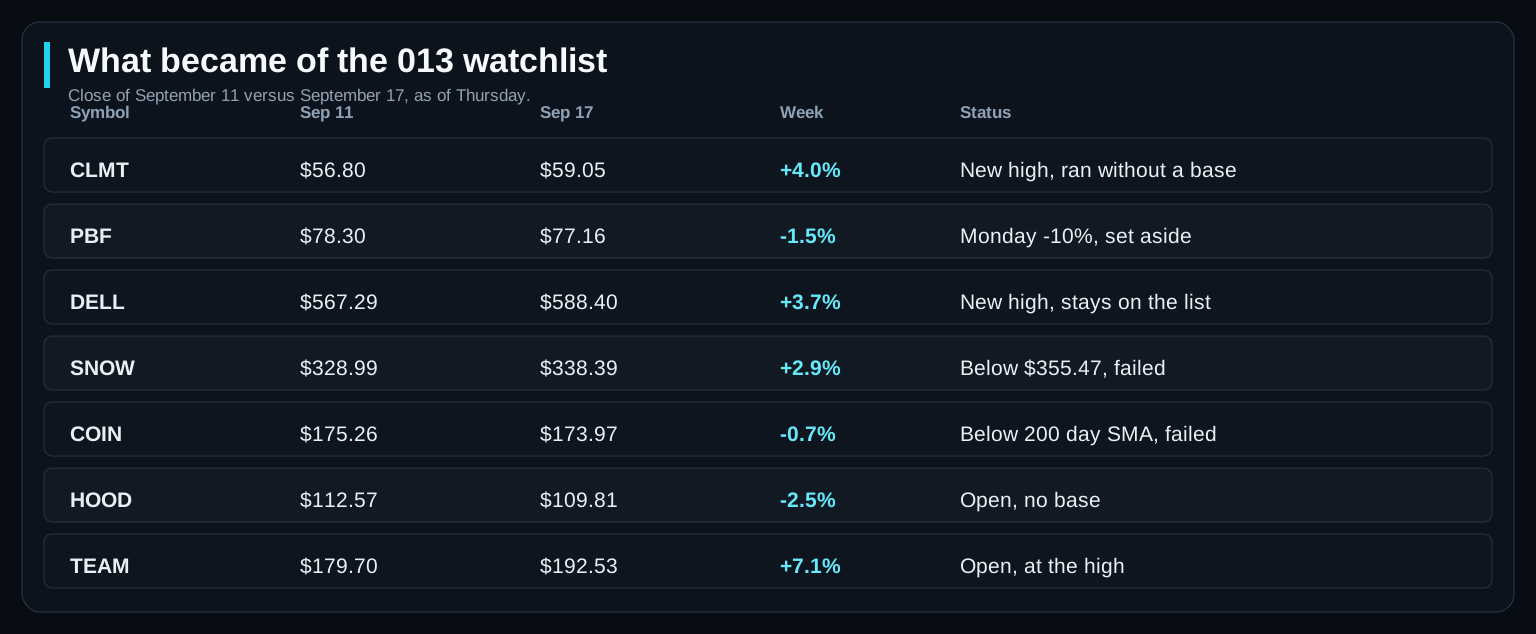
What became of the 013 watchlist
Issue 013 listed CLMT, PBF and DELL, plus the open observations SNOW, COIN, HOOD and TEAM from issue 012. Here is the state after four sessions. CLMT and DELL printed new 252 day highs on Thursday, DELL after a Monday drop to $534.28. Neither formed the tight base we wanted; price simply kept running.
PBF is the opposite case: minus ten percent on Monday and only a partial recovery by Thursday. Anyone who respected the 013 condition to wait for a consolidation did not take that drop. SNOW gained for the week but remains below its earnings day low. COIN stays below its 200 day average. TEAM is the strongest open name at plus 7.1 percent.
| Symbol | Week | Status | Close Sep 11 | Close Sep 17 |
|---|---|---|---|---|
| CLMT | +4.0% | New high, ran without a base | $56.80 | $59.05 |
| PBF | -1.5% | Monday -10%, set aside | $78.30 | $77.16 |
| DELL | +3.7% | New high, stays on the list | $567.29 | $588.40 |
| SNOW | +2.9% | Below $355.47, failed | $328.99 | $338.39 |
| COIN | -0.7% | Below 200 day SMA, failed | $175.26 | $173.97 |
| HOOD | -2.5% | Open, no base | $112.57 | $109.81 |
| TEAM | +7.1% | Open, at the high | $179.70 | $192.53 |
- Week
- +4.0%
- Status
- New high, ran without a base
- Close Sep 11
- $56.80
- Close Sep 17
- $59.05
- Week
- -1.5%
- Status
- Monday -10%, set aside
- Close Sep 11
- $78.30
- Close Sep 17
- $77.16
- Week
- +3.7%
- Status
- New high, stays on the list
- Close Sep 11
- $567.29
- Close Sep 17
- $588.40
- Week
- +2.9%
- Status
- Below $355.47, failed
- Close Sep 11
- $328.99
- Close Sep 17
- $338.39
- Week
- -0.7%
- Status
- Below 200 day SMA, failed
- Close Sep 11
- $175.26
- Close Sep 17
- $173.97
- Week
- -2.5%
- Status
- Open, no base
- Close Sep 11
- $112.57
- Close Sep 17
- $109.81
- Week
- +7.1%
- Status
- Open, at the high
- Close Sep 11
- $179.70
- Close Sep 17
- $192.53
These stocks stay outside the selection
SNOW trades above its 200 day average but has not reclaimed the September 3 earnings day low at $355.47. COIN sits below its 200 day average with RS 44, 56 percent below its 52 week high. LEN meets none of our conditions. PBF damaged its structure with Monday's drop and needs a new base first. RXRX, named in many genomics lists, carries RS 60 and sits 49 percent below its high.
A passed filter does not replace a look at the actual chart. The reverse also applies: a strong group name without strength of its own does not make the list.
| Symbol | RS | Close | Reason |
|---|---|---|---|
| SNOW | 93 | $338.39 | Lost the earnings day low |
| COIN | 44 | $173.97 | Below 200 day SMA, 56% below the high |
| LEN | 19 | $79.70 | Below every average, weak results |
| PBF | 98 | $77.16 | Monday drop, needs a new base |
| RXRX | 60 | $3.54 | Weak own strength despite the group |
- RS
- 93
- Close
- $338.39
- Reason
- Lost the earnings day low
- RS
- 44
- Close
- $173.97
- Reason
- Below 200 day SMA, 56% below the high
- RS
- 19
- Close
- $79.70
- Reason
- Below every average, weak results
- RS
- 98
- Close
- $77.16
- Reason
- Monday drop, needs a new base
- RS
- 60
- Close
- $3.54
- Reason
- Weak own strength despite the group
What matters on Friday and next week
The Bank of Japan hiked on Friday morning. US industrial production for August follows at 9:15 a.m. Eastern. Next week brings earnings from AutoZone and Worthington Enterprises, followed by US new home sales on Wednesday and durable goods orders on Thursday.
Those events test three separate parts of the story: global rates, the consumer and industry. New home sales will be especially useful in deciding whether Lennar reflects a company issue or broader housing weakness. Marvell's investor day follows on October 6.
| Event | Date | Question |
|---|---|---|
| Bank of Japan | Sep 18 | Hiked to around 1.25 percent, 7 to 2 vote |
| US industrial production | Sep 18 | Can output hold up under higher rates? |
| AutoZone and Worthington | Sep 22 | How resilient are consumer and industry? |
| US new home sales | Sep 24 | Does the data confirm Lennar weakness? |
| Durable goods | Sep 25 | Are business investments holding? |
| Marvell investor day | Oct 6 | How large is the AI infrastructure backlog? |
- Bank of Japan
- Date
- Sep 18
- Question
- Hiked to around 1.25 percent, 7 to 2 vote
- US industrial production
- Date
- Sep 18
- Question
- Can output hold up under higher rates?
- AutoZone and Worthington
- Date
- Sep 22
- Question
- How resilient are consumer and industry?
- US new home sales
- Date
- Sep 24
- Question
- Does the data confirm Lennar weakness?
- Durable goods
- Date
- Sep 25
- Question
- Are business investments holding?
- Marvell investor day
- Date
- Oct 6
- Question
- How large is the AI infrastructure backlog?

The list for Monday
CDNA, TWST and NTRA remain the clearest genomics names. CRWD, OKTA and PANW will show whether cybersecurity can hold its move. Within energy, CLMT, CVI and MPC stay relevant, but only after a pause. DELL represents the AI group and set a new high on Thursday. New on the list are MRVL with its closed post earnings gap and MRNA with the base after the August jump.
The sequence is simple. First check whether breadth stabilizes. Then see which groups remain near the top. Only then move to the individual chart. SPY is not a position here but the test of whether the market can carry new entries at all.
| Symbol | RS | Role | Test | From high |
|---|---|---|---|---|
| CDNA | 99 | Genomics leader | Tight pause above short averages | -1.6% |
| TWST | 99 | Genomics, wide range | Small position only | -0.3% |
| NTRA | 97 | Genomics, calmest chart | Hold the high, check volume | 0.0% |
| CRWD | 97 | Cybersecurity confirmation | Breakout must hold | -1.9% |
| OKTA | 98 | Cybersecurity | Pause at the high | -0.2% |
| PANW | 96 | Cybersecurity, liquid | Return to the high | -5.1% |
| CLMT | 99 | Refining leader | Do not chase extension | -0.4% |
| DELL | 99 | AI leader | Stay close to the high | -0.9% |
| MRVL | 98 | Semis, gap closed | Above $248 on volume | -27.0% |
| MRNA | 99 | Biotech catalyst | Close above $159, half size | -10.5% |
- RS
- 99
- Role
- Genomics leader
- Test
- Tight pause above short averages
- From high
- -1.6%
- RS
- 99
- Role
- Genomics, wide range
- Test
- Small position only
- From high
- -0.3%
- RS
- 97
- Role
- Genomics, calmest chart
- Test
- Hold the high, check volume
- From high
- 0.0%
- RS
- 97
- Role
- Cybersecurity confirmation
- Test
- Breakout must hold
- From high
- -1.9%
- RS
- 98
- Role
- Cybersecurity
- Test
- Pause at the high
- From high
- -0.2%
- RS
- 96
- Role
- Cybersecurity, liquid
- Test
- Return to the high
- From high
- -5.1%
- RS
- 99
- Role
- Refining leader
- Test
- Do not chase extension
- From high
- -0.4%
- RS
- 99
- Role
- AI leader
- Test
- Stay close to the high
- From high
- -0.9%
- RS
- 98
- Role
- Semis, gap closed
- Test
- Above $248 on volume
- From high
- -27.0%
- RS
- 99
- Role
- Biotech catalyst
- Test
- Close above $159, half size
- From high
- -10.5%
Risk in bundles: genomics, cyber and semis
Three genomics names, three cybersecurity names and two semiconductor stocks on one list means one headline can hit several positions at once. Anyone holding several stocks from the same group should treat the sum of those positions as a single one.
Daily ranges differ widely. NTRA moves 3.2 percent a day on average, MRNA 11.1 percent. With the same dollar risk to the stop, MRNA ends up with a much smaller share count. During fast moves or gaps the actual fill can differ from the planned stop. That is why the next earnings dates belong in the preparation: MRNA on November 5, MRVL in early December, plus the investor day on October 6.
Fewer stocks. Better reasons.
This week was not a universal selloff. It was a selection process. Higher rates weighed on the broad market, but capital did not disappear. It moved into a small number of groups with visible relative strength, and on Thursday it came back broadly as soon as yields eased.
That is why every falling stock should not be treated as cheap. The market is already showing which names are being bought despite the headwind. Our job is not to guess that strength. We need to see it, verify it and wait for an entry where risk can be controlled. Friday's close decides whether Thursday was the start of something or a single day.