
Nasdaq at a record. Yields rise with it.
On Tuesday, September 22, the Nasdaq Composite closed at 27,244, the highest close in its history. The Nasdaq 100 also set a record close at 30,732. In the same week semiconductors, software and quantum computing climbed sharply in the WickedDesk theme ranking.
The bill arrived a day later. S&P Global reported the fastest growth in US business activity since July 2021, and the ten-year Treasury yield jumped from 4.96 to 5.11 percent. On Thursday it rose further to 5.18 percent, and the 30-year mortgage rate crossed 7 percent. The Nasdaq held just below its record, but on Wednesday 811 stocks fell at least 4 percent. Strong growth helps revenue, but it keeps rates high. That tension defines the week.
The week in five numbers
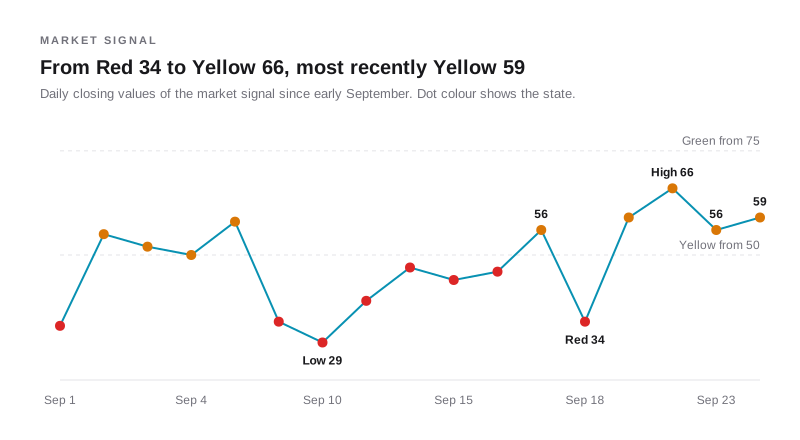
The market signal stands at Yellow 59, after Red 34 at the close of the prior week and Yellow 66 on Tuesday. Since the prior week's close QQQ is up 2.72 percent and SPY 0.72 percent, while IWM is down 0.86 percent. The large technology names are lifting the index, and breadth is not following.
Only 31.1 percent of stocks trade above their 50-day line. Two out of three stocks trade below it. Anyone who only watches the Nasdaq misses that entirely.
| Item | Value | Meaning |
|---|---|---|
| Market signal | Yellow 59 | Prior week Red 34, weekly high Yellow 66 |
| Nasdaq 100 | Record 30,732 | On Sep 22, week +2.82% |
| 10-year Treasury yield | 5.18% | Highest close of 2026 |
| 30-year mortgage rate | 7.03% | Highest since January 2025 |
| Stocks above 50-day line | 31.1% | 36.2% at issue 014 |
- Market signal
- Value
- Yellow 59
- Meaning
- Prior week Red 34, weekly high Yellow 66
- Nasdaq 100
- Value
- Record 30,732
- Meaning
- On Sep 22, week +2.82%
- 10-year Treasury yield
- Value
- 5.18%
- Meaning
- Highest close of 2026
- 30-year mortgage rate
- Value
- 7.03%
- Meaning
- Highest since January 2025
- Stocks above 50-day line
- Value
- 31.1%
- Meaning
- 36.2% at issue 014
The market signal swings between Red 34 and Yellow 66
The market signal now keeps a daily history. Every trading day gets its own closing value. At the close of the prior week the signal stood at Red 34. Monday brought Yellow 59, Tuesday Yellow 66, Wednesday Yellow 56 and Thursday Yellow 59 again. Issue 014 quoted Red 48, the live value before the US open. The daily history records Yellow 56 as the closing value for the Thursday before.
The components are far apart. On Wednesday, the weakest day of the week, index trend scored 67 out of 100 because two of three core indexes were in a short-term uptrend. Breadth scored only 25, with just 24.1 percent of stocks rising. On Thursday 41.2 percent rose, 300 stocks gained at least 4 percent and 437 lost as much. Yellow is not an all clear here. New positions need a strong group, a tight structure and volume. If the signal drops below 50, it turns red again.
| Metric | Points | Weight | Reading |
|---|---|---|---|
| Index trend | 67 | 25% | 2 of 3 core indexes in a short-term uptrend |
| Breadth | 25 | 25% | Wednesday 24.1% of stocks rising, 189 against 811 |
| Leadership | 65 | 15% | 676 stocks with strong momentum |
| Rates and credit | 60 | 15% | 10-year above 5% |
| Dollar and energy | 53 | 10% | Oil near its highs |
| Inflation and Fed | 68 | 10% | Consumer prices +3.4% year over year |
| Volatility | 85 | 5% | VIX 15.2 |
- Index trend
- Points
- 67
- Weight
- 25%
- Reading
- 2 of 3 core indexes in a short-term uptrend
- Breadth
- Points
- 25
- Weight
- 25%
- Reading
- Wednesday 24.1% of stocks rising, 189 against 811
- Leadership
- Points
- 65
- Weight
- 15%
- Reading
- 676 stocks with strong momentum
- Rates and credit
- Points
- 60
- Weight
- 15%
- Reading
- 10-year above 5%
- Dollar and energy
- Points
- 53
- Weight
- 10%
- Reading
- Oil near its highs
- Inflation and Fed
- Points
- 68
- Weight
- 10%
- Reading
- Consumer prices +3.4% year over year
- Volatility
- Points
- 85
- Weight
- 5%
- Reading
- VIX 15.2
A Nasdaq record, the S&P 500 stays below
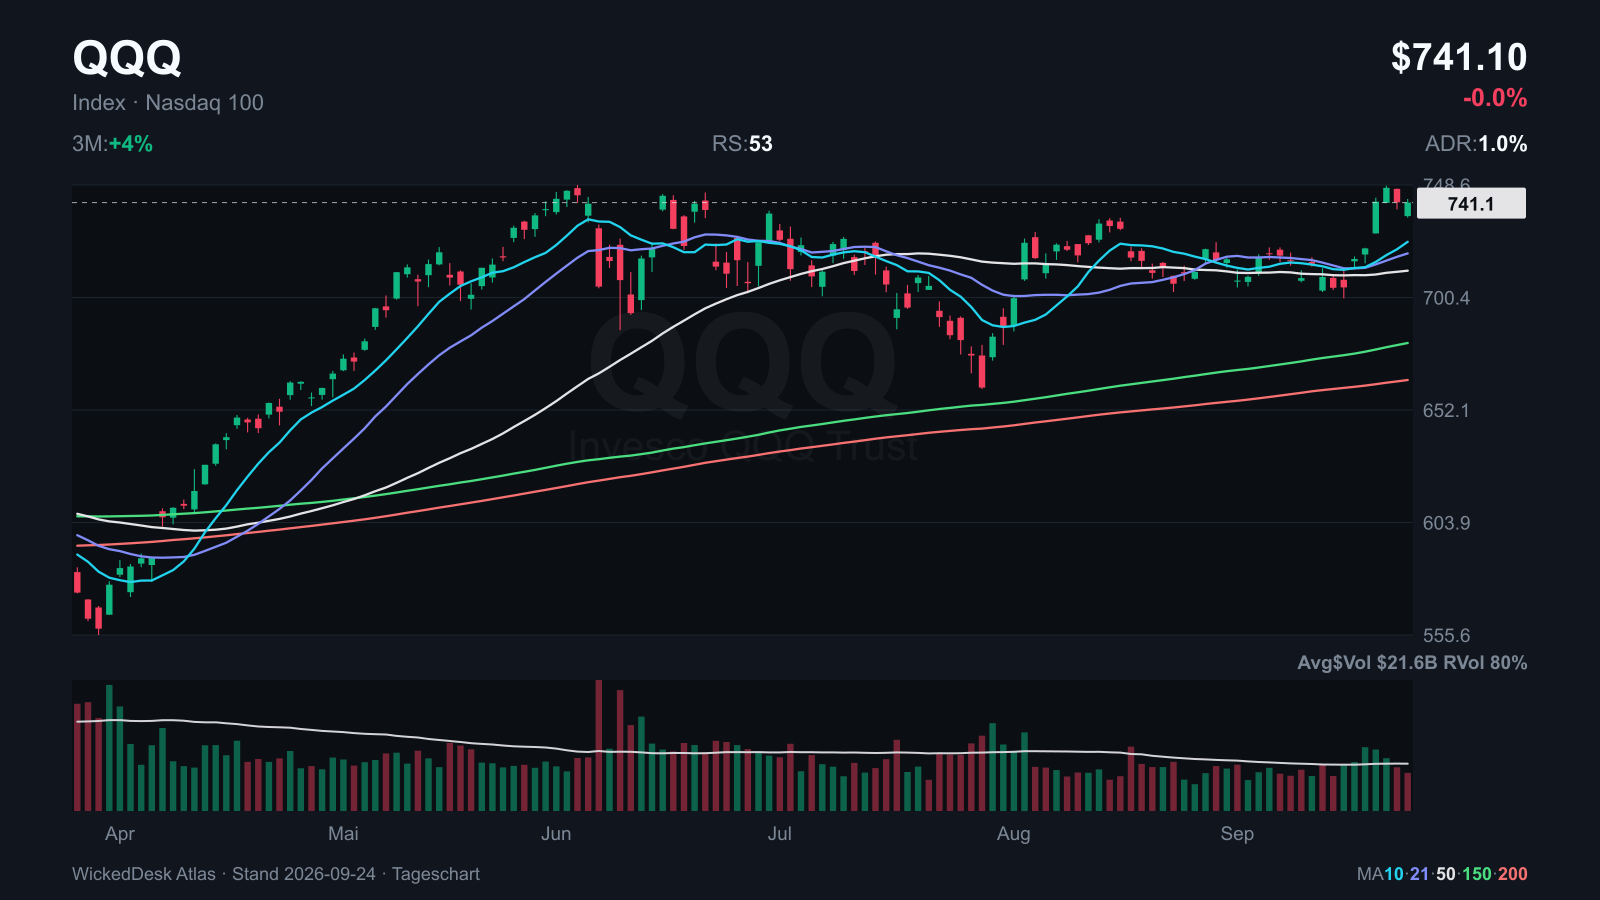
The Nasdaq Composite closed at 27,122 on Monday and 27,244 on Tuesday, two record closes in a row. The prior high from June 2 stood at 27,094. QQQ, the Nasdaq 100 ETF, closed Tuesday at $747.46, above its June high of $746.16. After that QQQ hovered around $741, and the week stands at plus 2.72 percent.
SPY did not join the move. The ETF trades 1.4 percent below its record close from August 13 and only 0.8 percent above its 50-day line. IWM is down 0.86 percent for the week and trades 4.3 percent below its 50-day line. Smaller companies react more to expensive financing, and that is exactly where selling hit hardest on Wednesday.
| Week | Close | Market | Prior week |
|---|---|---|---|
| +2.82% | 30,479 | Nasdaq 100 | 29,644 |
| +1.57% | 26,939 | Nasdaq Composite | 26,523 |
| +2.72% | $741.10 | QQQ | $721.45 |
| +0.72% | $767.18 | SPY | $761.69 |
| -0.62% | $512.68 | DIA | $515.88 |
| -0.86% | $281.66 | IWM | $284.10 |
- +2.82%
- Close
- 30,479
- Market
- Nasdaq 100
- Prior week
- 29,644
- +1.57%
- Close
- 26,939
- Market
- Nasdaq Composite
- Prior week
- 26,523
- +2.72%
- Close
- $741.10
- Market
- QQQ
- Prior week
- $721.45
- +0.72%
- Close
- $767.18
- Market
- SPY
- Prior week
- $761.69
- -0.62%
- Close
- $512.68
- Market
- DIA
- Prior week
- $515.88
- -0.86%
- Close
- $281.66
- Market
- IWM
- Prior week
- $284.10
On Wednesday 811 stocks fall at least 4 percent
On Wednesday only 1,144 of 4,741 screened stocks rose while 3,434 fell. 811 stocks lost at least 4 percent and 189 gained as much. Thursday brought only a partial recovery, with 300 stocks gaining at least 4 percent and 437 losing as much. The share above the 50-day line dropped from 37.4 percent on Tuesday to 31.1 percent. At issue 014 it was 36.2 percent.
160 stocks trade near their 52-week high and 224 near their low. Over one month 1,095 stocks lost at least 13 percent and only 461 gained at least 13 percent. A Nasdaq record with breadth like this means a small number of large names carry the index. For the watchlist that leads to a simple rule. We only take stocks that rise on a day like this Wednesday, or at least hold their level.
| Metric | Now | Issue 014 |
|---|---|---|
| Stocks above 50-day line | 31.1% | 36.2% |
| Near 52-week high | 160 | 185 |
| Near 52-week low | 224 | 215 |
| 1 month +13% / -13% | 461 / 1,095 | 466 / 1,051 |
| Day +4% / -4% | 300 / 437 | 727 / 169 |
- Stocks above 50-day line
- Now
- 31.1%
- Issue 014
- 36.2%
- Near 52-week high
- Now
- 160
- Issue 014
- 185
- Near 52-week low
- Now
- 224
- Issue 014
- 215
- 1 month +13% / -13%
- Now
- 461 / 1,095
- Issue 014
- 466 / 1,051
- Day +4% / -4%
- Now
- 300 / 437
- Issue 014
- 727 / 169
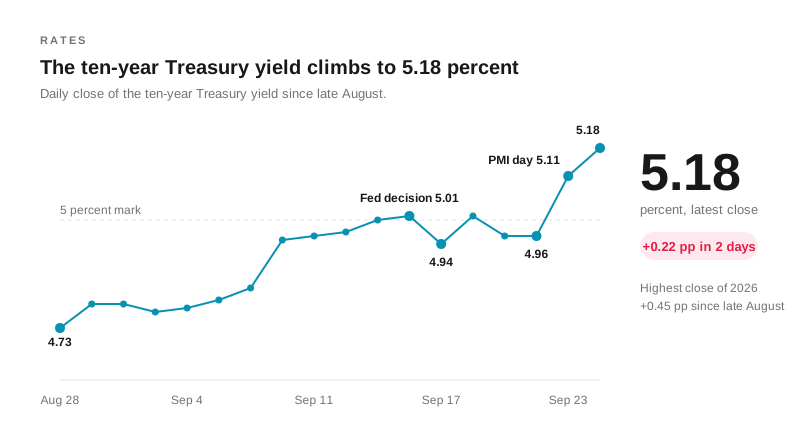
The yield climbs to 5.18 percent
The ten-year Treasury yield closed at 5.11 percent on Wednesday and 5.18 percent on Thursday, 0.22 percentage points above Tuesday. That is the highest close of this year, and no close in 2023, 2024 or 2025 was as high. The two-year yield stands at 4.87 percent and the thirty-year at 5.47 percent. The inflation-adjusted ten-year yield reached 2.85 percent, also a high for the year.
Since late August the ten-year yield has risen 0.45 percentage points. For richly valued stocks the real yield matters more, because it measures what investors earn without company risk. A Nasdaq record at a 2.85 percent real yield needs earnings growth that clears that hurdle. If the ten-year holds above 5 percent, small caps and rate-sensitive groups are likely to stay under pressure. A drop below 4.96 percent, the level of Monday and Tuesday, would give breadth room again.
| Now | Change | Maturity | Prior week |
|---|---|---|---|
| 4.87% | +0.11 pp | 2 years | 4.76% |
| 5.10% | +0.17 pp | 7 years | 4.93% |
| 5.18% | +0.17 pp | 10 years | 5.01% |
| 5.47% | +0.13 pp | 30 years | 5.34% |
| 2.85% | +0.17 pp | 10 years real | 2.68% |
- 4.87%
- Change
- +0.11 pp
- Maturity
- 2 years
- Prior week
- 4.76%
- 5.10%
- Change
- +0.17 pp
- Maturity
- 7 years
- Prior week
- 4.93%
- 5.18%
- Change
- +0.17 pp
- Maturity
- 10 years
- Prior week
- 5.01%
- 5.47%
- Change
- +0.13 pp
- Maturity
- 30 years
- Prior week
- 5.34%
- 2.85%
- Change
- +0.17 pp
- Maturity
- 10 years real
- Prior week
- 2.68%
The survey shows speed, industry stands still
S&P Global released its flash PMI for September on Wednesday. The composite index rose from 56.0 to 58.4, the fastest expansion since July 2021. The services index climbed from 56.5 to 58.7 and the manufacturing PMI from 53.9 to 57.0. Companies added jobs at the fastest pace in more than four years, and input costs rose at the steepest rate since October 2022. Firms point to fuel and transport as the drivers.
Official industrial production paints a weaker picture. According to the Fed it was unchanged in August, manufacturing output fell 0.3 percent and capacity utilization stood at 76.3 percent. For the central bank the price component of the survey matters most, and rising input costs argue against quick rate cuts. New home sales rose in August, more on that in the next chapter. According to the Census Bureau, durable goods orders were virtually unchanged in August at $338.6 billion after a 0.9 percent rise in July. Excluding transportation, orders rose 0.3 percent. Industry keeps investing, but without momentum.
What Changed The Weekly Plan
Composite PMI, September
Services PMI, September
Manufacturing PMI, September
US industrial production, August
US new home sales, August, annual rate
Durable goods, August
Rates reach the housing market
The 30-year mortgage rate stands at 7.03 percent according to Freddie Mac, after 6.95 percent the week before and 6.66 percent four weeks earlier. The last time it was this high was January 2025. On Thursday the Treasury sold $44 billion of seven-year notes at 5.085 percent, compared with 4.512 percent in August. Demand eased slightly, with $2.42 bid for every dollar sold against $2.50 last time.
New home sales have held up so far. August sales ran at an annual rate of 684,000, 6.4 percent above July but 2.0 percent below a year earlier. The Census Bureau puts the margin of error at 19.5 percent, so the gain is not statistically certain. The median price of $393,700 was 5.8 percent below the prior year, and supply covers 8.5 months. Volume went up, prices did not. The homebuilder ETF ITB trades 7.1 percent below its 50-day line and 23 percent below its high, and LEN carries RS 19. For swing traders housing stays a group to watch, not one for the study list. Only a yield back below 5 percent would change that.
| Metric | Now | Prior |
|---|---|---|
| 30-year mortgage rate | 7.03% | 6.95% |
| 7-year auction, yield | 5.085% | 4.512% |
| 7-year auction, bid-to-cover | 2.42 | 2.50 |
| New home sales, annual rate | 684,000 | 643,000 |
| Median new home price | $393,700 | $392,200 |
- 30-year mortgage rate
- Now
- 7.03%
- Prior
- 6.95%
- 7-year auction, yield
- Now
- 5.085%
- Prior
- 4.512%
- 7-year auction, bid-to-cover
- Now
- 2.42
- Prior
- 2.50
- New home sales, annual rate
- Now
- 684,000
- Prior
- 643,000
- Median new home price
- Now
- $393,700
- Prior
- $392,200
Atlas: QQQ above its June high, the first test is under way
The daily chart shows the sideways phase since early June and Monday's breakout. QQQ gained 2.77 percent to $741.47 that day and closed Tuesday at $747.46, above the June high. Since then the ETF has hovered around $741, 3.0 percent above its 21-day line and 4.1 percent above its 50-day line.
Volume stayed below the 50-day average during the pullbacks. A pause on light volume is a normal part of a breakout. It becomes a problem if QQQ drops below $721.45, the prior week's close. Then the record would be a failed breakout.
Technology ranks first, energy drops to fourth
Technology ranks first in the sector ranking, up from second last week. Health care slips to second and energy to fourth. Over five trading days energy lost 5.8 percent, consumer cyclicals 5.7 percent and consumer staples 5.1 percent. Technology is the only sector in positive territory at plus 1.2 percent.
That matches the index picture. Buyers are concentrating on technology while almost every other sector gives ground. In energy the refiners take the hardest hit after leading in recent issues. The refining and marketing subgroup hands first place to diagnostics and research.
| Sector | Rank | 5 days | 1 month | Leaders | 3 months |
|---|---|---|---|---|---|
| Technology | 1 (prior 2) | +1.2% | +0.2% | QMCO, MXL, OKTA, DELL | +6.7% |
| Health care | 2 (prior 1) | -2.8% | -2.5% | MRNA, TXG, IOVA, CDNA | +12.7% |
| Communication | 3 (prior 4) | -1.7% | -3.4% | ASST, ATEX, ROKU, AMC | +4.3% |
| Energy | 4 (prior 3) | -5.8% | -3.3% | CLMT, CVI, PBF, DINO | +3.6% |
| Financials | 5 | -4.0% | -5.2% | BMNR, HUT, BWIN, PACS | +0.7% |
| Consumer staples | 6 | -5.1% | -4.1% | CHEF, ELF, GO, DAR | -1.8% |
- Technology
- Rank
- 1 (prior 2)
- 5 days
- +1.2%
- 1 month
- +0.2%
- 3 months
- +6.7%
- Health care
- Rank
- 2 (prior 1)
- 5 days
- -2.8%
- 1 month
- -2.5%
- 3 months
- +12.7%
- Communication
- Rank
- 3 (prior 4)
- 5 days
- -1.7%
- 1 month
- -3.4%
- 3 months
- +4.3%
- Energy
- Rank
- 4 (prior 3)
- 5 days
- -5.8%
- 1 month
- -3.3%
- 3 months
- +3.6%
- Financials
- Rank
- 5
- 5 days
- -4.0%
- 1 month
- -5.2%
- 3 months
- +0.7%
- Consumer staples
- Rank
- 6
- 5 days
- -5.1%
- 1 month
- -4.1%
- 3 months
- -1.8%
Semis, software and quantum computing move up
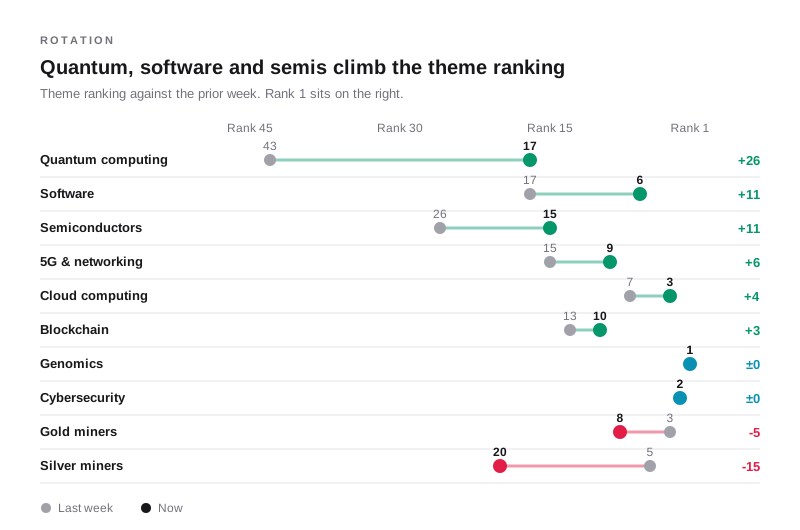
Genomics and cybersecurity hold first and second place in the theme ranking. Cybersecurity gained 6.9 percent over five trading days and 45.2 percent over three months, and 77 percent of its members are up over one month. On Wednesday, as breadth collapsed, the theme gained 1.6 percent on average.
The biggest jumps come from other groups. Quantum computing climbs from 43rd to 17th, software from 17th to 6th, semiconductors from 26th to 15th and cloud computing from 7th to 3rd. QMCO, the leader in the quantum basket and in the technology sector, gained 13.6 percent on Thursday on three times normal volume. Blockchain gained 14.6 percent over five days but is still down 11.9 percent over three months. That is a rebound in a weak group, not leadership yet. Silver miners fall from 5th to 20th and gold miners from 3rd to 8th.
| Theme | Rank | 5 days | Leaders | 3 months |
|---|---|---|---|---|
| Genomics | 1, prior 1 | +13.9% | TXG, CDNA, TWST, NTRA | +64.7% |
| Cybersecurity | 2, prior 2 | +6.9% | OKTA, CRWD, PANW, NET | +45.2% |
| Cloud computing | 3, prior 7 | +4.4% | OKTA, CRWD, PANW, DDOG | +42.6% |
| Software | 6, prior 17 | +4.0% | CRWD, PANW, DDOG, SNOW | +22.1% |
| Blockchain | 10, prior 13 | +14.6% | HUT, MSTR, HOOD, RIOT | -11.9% |
| Semiconductors | 15, prior 26 | +5.9% | AMD, INTC, MU, MRVL | -8.4% |
| Quantum computing | 17, prior 43 | +14.3% | QMCO, IONQ, QUBT, RGTI | -5.2% |
| Silver miners | 20, prior 5 | -8.1% | HL, CDE | +15.9% |
- Genomics
- Rank
- 1, prior 1
- 5 days
- +13.9%
- 3 months
- +64.7%
- Cybersecurity
- Rank
- 2, prior 2
- 5 days
- +6.9%
- 3 months
- +45.2%
- Cloud computing
- Rank
- 3, prior 7
- 5 days
- +4.4%
- 3 months
- +42.6%
- Software
- Rank
- 6, prior 17
- 5 days
- +4.0%
- 3 months
- +22.1%
- Blockchain
- Rank
- 10, prior 13
- 5 days
- +14.6%
- 3 months
- -11.9%
- Semiconductors
- Rank
- 15, prior 26
- 5 days
- +5.9%
- 3 months
- -8.4%
- Quantum computing
- Rank
- 17, prior 43
- 5 days
- +14.3%
- 3 months
- -5.2%
- Silver miners
- Rank
- 20, prior 5
- 5 days
- -8.1%
- 3 months
- +15.9%
Genomics takes Thursday
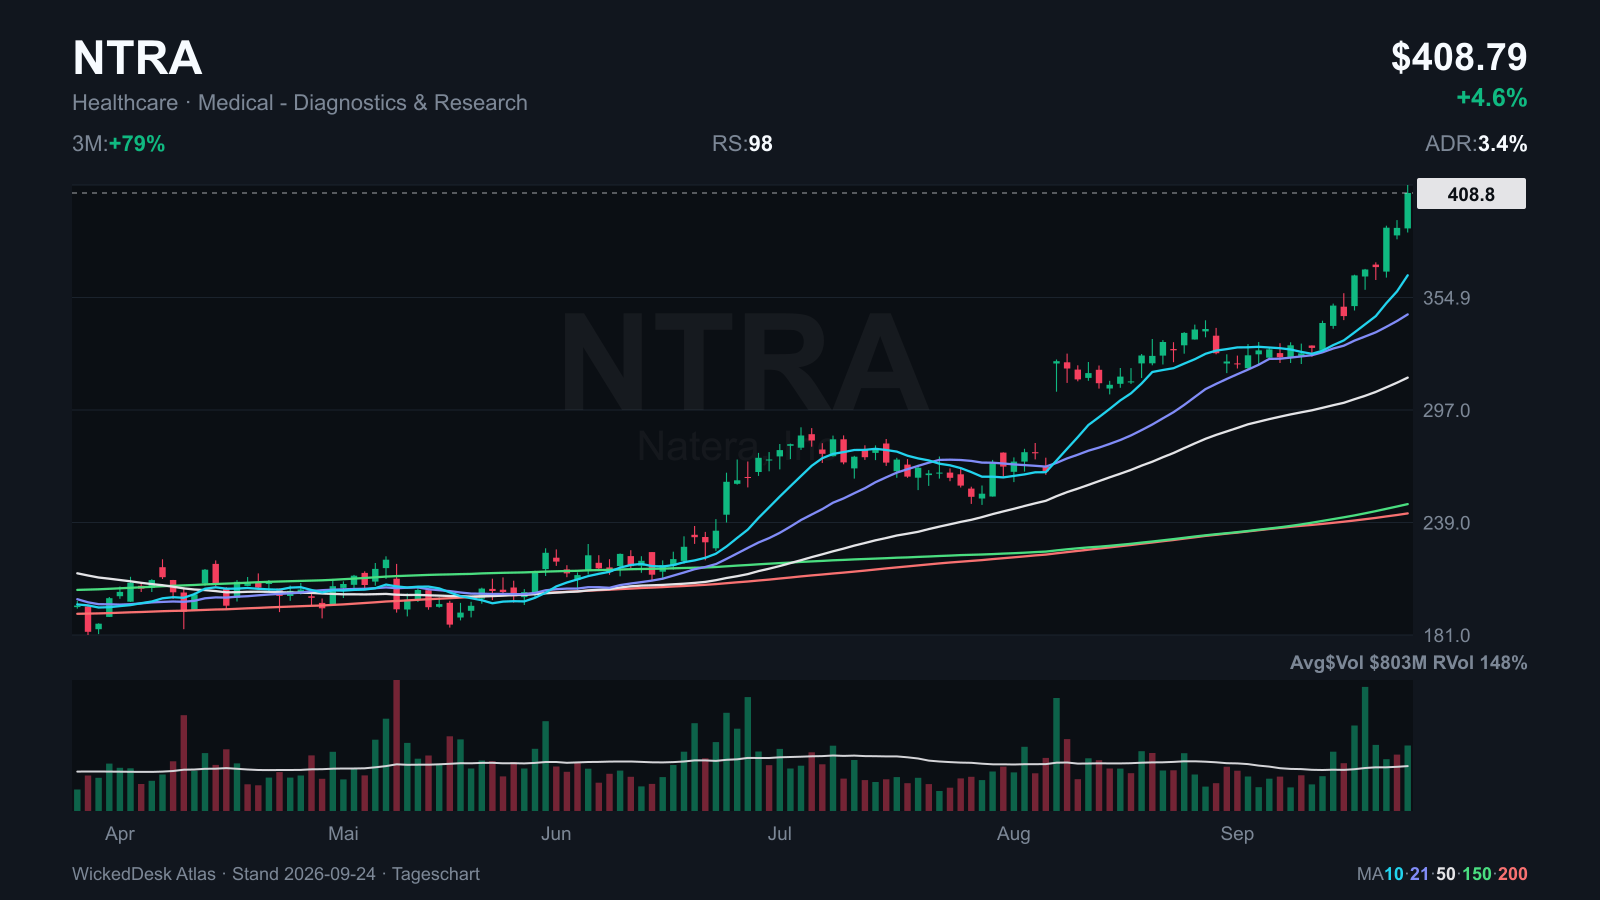
On Wednesday genomics lost 4.3 percent on average, and on Thursday the group turned on volume. TWST gained 16.1 percent to $184.03 and CDNA 13.0 percent to $61.37, both on twice their 50-day volume. ILMN rose 7.3 percent to $273.90 and NTRA 4.6 percent to $408.79. All four closed at their highest level in at least a year. The SEC filing index shows no company report for any of the four since September 17.
The theme basket is up 13.9 percent over five days and 64.7 percent over three months, and 87.5 percent of its members are up over one month. That is accumulation across a whole group, not in a single name. After one-day jumps of 13 to 16 percent, however, TWST and CDNA are extended in the short term. We are waiting for a tight pause above Wednesday's close. If TWST drops below $158.50 or CDNA below $54.31, Thursday was only a reflex.
| Symbol | RS | ADR | Close | Volume | Thursday |
|---|---|---|---|---|---|
| TWST | 99 | 7.3% | $184.03 | 2.1x | +16.1% |
| CDNA | 99 | 4.6% | $61.37 | 2.0x | +13.0% |
| ILMN | 97 | 4.7% | $273.90 | 1.3x | +7.3% |
| NTRA | 98 | 3.4% | $408.79 | 1.5x | +4.6% |
- RS
- 99
- ADR
- 7.3%
- Close
- $184.03
- Volume
- 2.1x
- Thursday
- +16.1%
- RS
- 99
- ADR
- 4.6%
- Close
- $61.37
- Volume
- 2.0x
- Thursday
- +13.0%
- RS
- 97
- ADR
- 4.7%
- Close
- $273.90
- Volume
- 1.3x
- Thursday
- +7.3%
- RS
- 98
- ADR
- 3.4%
- Close
- $408.79
- Volume
- 1.5x
- Thursday
- +4.6%
Atlas: CDNA leaves its range on double volume
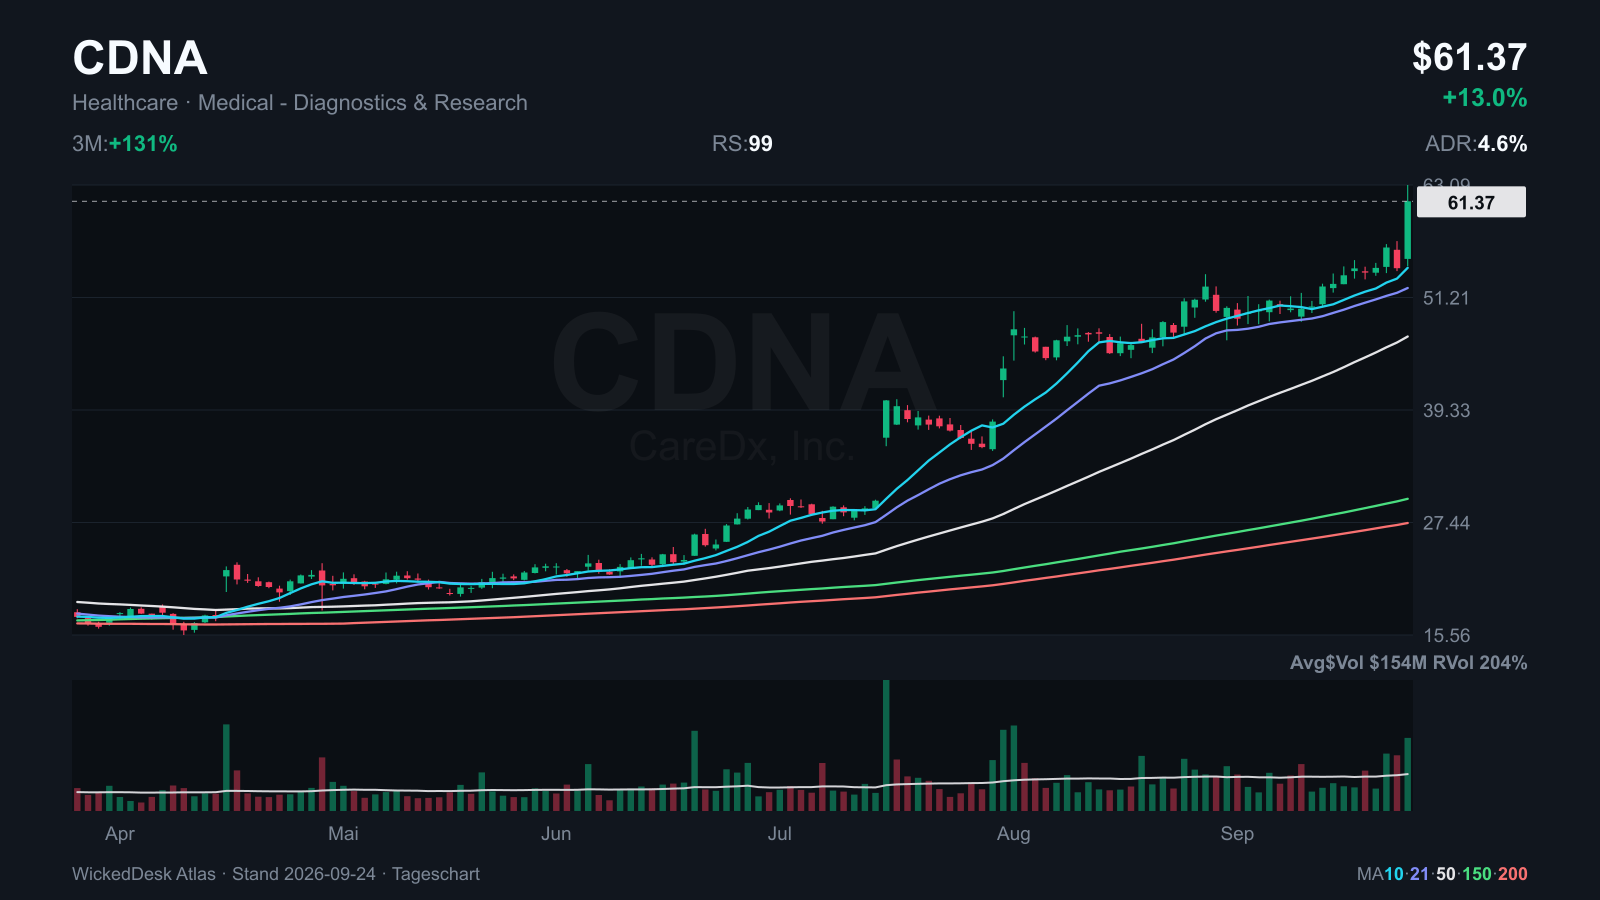
CareDx traded between $50 and $57 since mid-September. On Thursday the stock closed at $61.37, well above that range, on twice its 50-day volume. RS 99, plus 131 percent over three months, with an average daily range of 4.6 percent. The stock sits 17.6 percent above its 21-day line.
CDNA was already on the 014 list and returns now as a breakout candidate. Buying the next morning would mean chasing. A pause above $57, the top of the old range, is what we want to see. A close below that level would call the breakout into question.
What became of the 014 watchlist
Issue 014 had ten names on the list. Since then eight are up and two are down. The cybersecurity names CRWD, OKTA and PANW held their breakouts, and OKTA closed at a new high on Thursday. NTRA, CDNA and TWST set new closing highs with the genomics move.
MRNA met the condition from 014. We asked for a close above $159 on more than 20 million shares. On Monday the stock closed at $172.94 on 21 million shares and now trades at $194.82. MRVL cleared the $248 price level but without the volume we asked for. CLMT and DELL broke down and come off the list.
| Symbol | Now | Change | Status | Issue 014 |
|---|---|---|---|---|
| CDNA | $61.37 | +13.1% | New closing high | $54.28 |
| TWST | $184.03 | +18.3% | New closing high | $155.56 |
| NTRA | $408.79 | +11.6% | Held, new closing high | $366.31 |
| CRWD | $259.67 | +5.7% | Held, 1.1% below closing high | $245.70 |
| OKTA | $206.64 | +8.7% | Held, new closing high | $190.02 |
| PANW | $389.92 | +4.0% | Held, 1.5% below Aug 13 closing high | $375.06 |
| CLMT | $53.85 | -8.8% | Broken | $59.05 |
| DELL | $536.02 | -8.9% | Broken | $588.40 |
| MRVL | $258.95 | +7.6% | Open, volume missing | $240.76 |
| MRNA | $194.82 | +23.3% | Breakout on Sep 21, new high | $158.07 |
- Now
- $61.37
- Change
- +13.1%
- Status
- New closing high
- Issue 014
- $54.28
- Now
- $184.03
- Change
- +18.3%
- Status
- New closing high
- Issue 014
- $155.56
- Now
- $408.79
- Change
- +11.6%
- Status
- Held, new closing high
- Issue 014
- $366.31
- Now
- $259.67
- Change
- +5.7%
- Status
- Held, 1.1% below closing high
- Issue 014
- $245.70
- Now
- $206.64
- Change
- +8.7%
- Status
- Held, new closing high
- Issue 014
- $190.02
- Now
- $389.92
- Change
- +4.0%
- Status
- Held, 1.5% below Aug 13 closing high
- Issue 014
- $375.06
- Now
- $53.85
- Change
- -8.8%
- Status
- Broken
- Issue 014
- $59.05
- Now
- $536.02
- Change
- -8.9%
- Status
- Broken
- Issue 014
- $588.40
- Now
- $258.95
- Change
- +7.6%
- Status
- Open, volume missing
- Issue 014
- $240.76
- Now
- $194.82
- Change
- +23.3%
- Status
- Breakout on Sep 21, new high
- Issue 014
- $158.07
Atlas: MRNA breaks out and keeps going
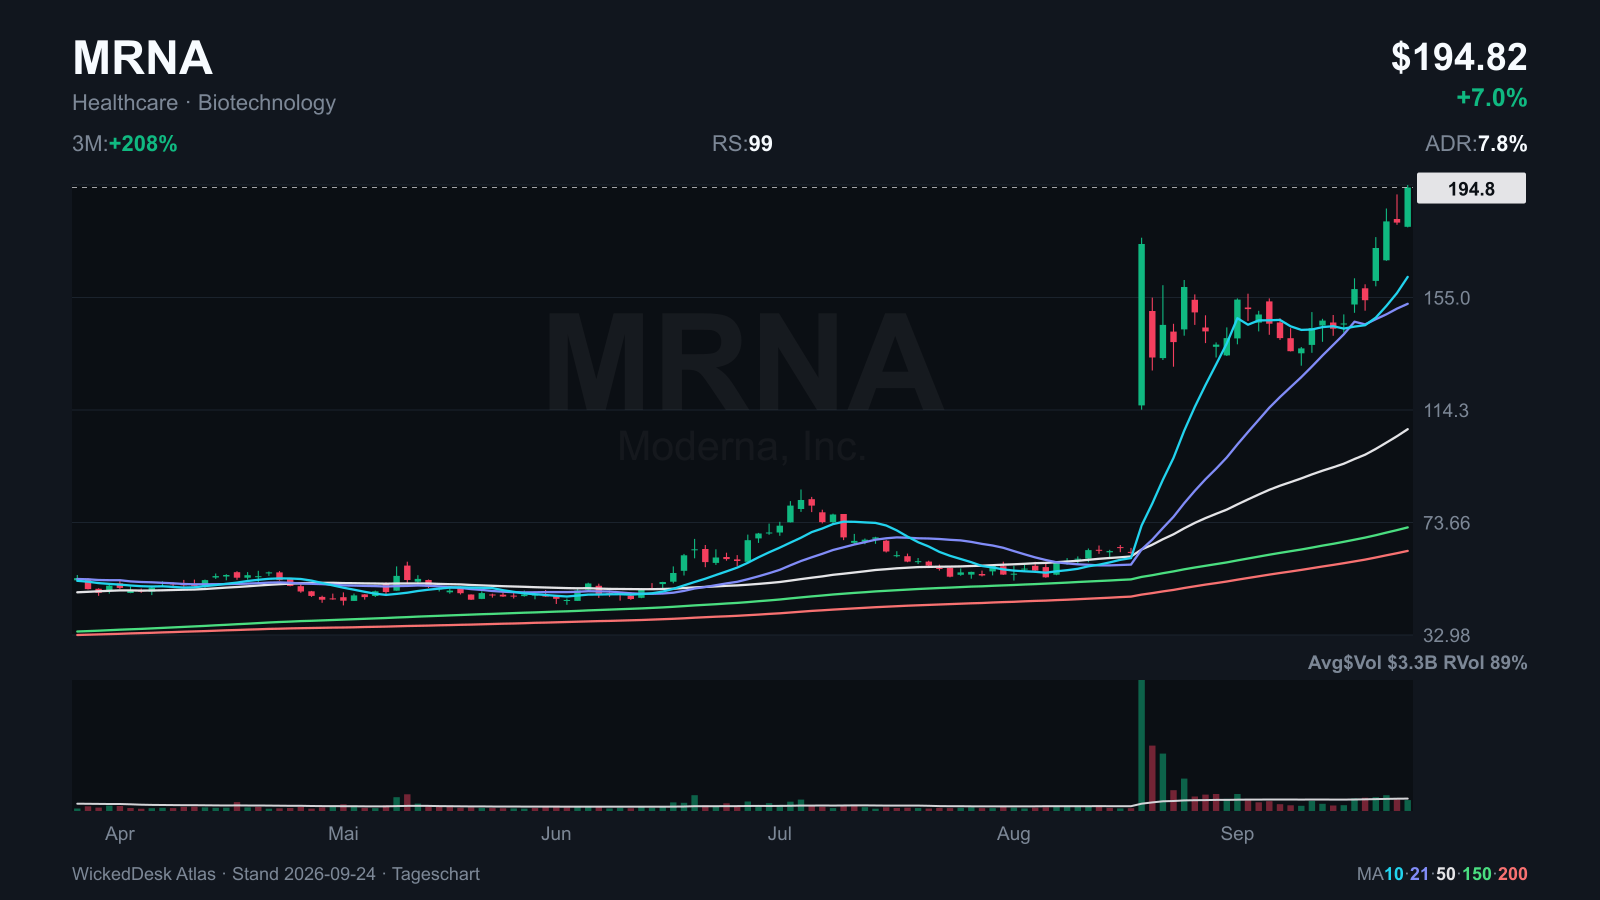
On Monday MRNA gained 12.3 percent to $172.94 and left the base it had built since August 20. Tuesday added another 5.6 percent to $182.56, above the August 19 high of $176.66. On Wednesday the stock turned lower from an intraday high of $192.31, and on Thursday it rose 7.0 percent to $194.82, closing at the high of the move.
After the breakout the stock trades 81 percent above its 50-day line and 27.6 percent above its 21-day line, with an average daily range of 7.8 percent. That is too extended for a new entry. MRNA becomes interesting again with a tight pause above $172.94, Monday's breakout close. A close below that level would call the breakout into question. The SEC filing index shows no new company report since September 1.
Atlas: CRWD hits a one-year high on the weakest day of the week
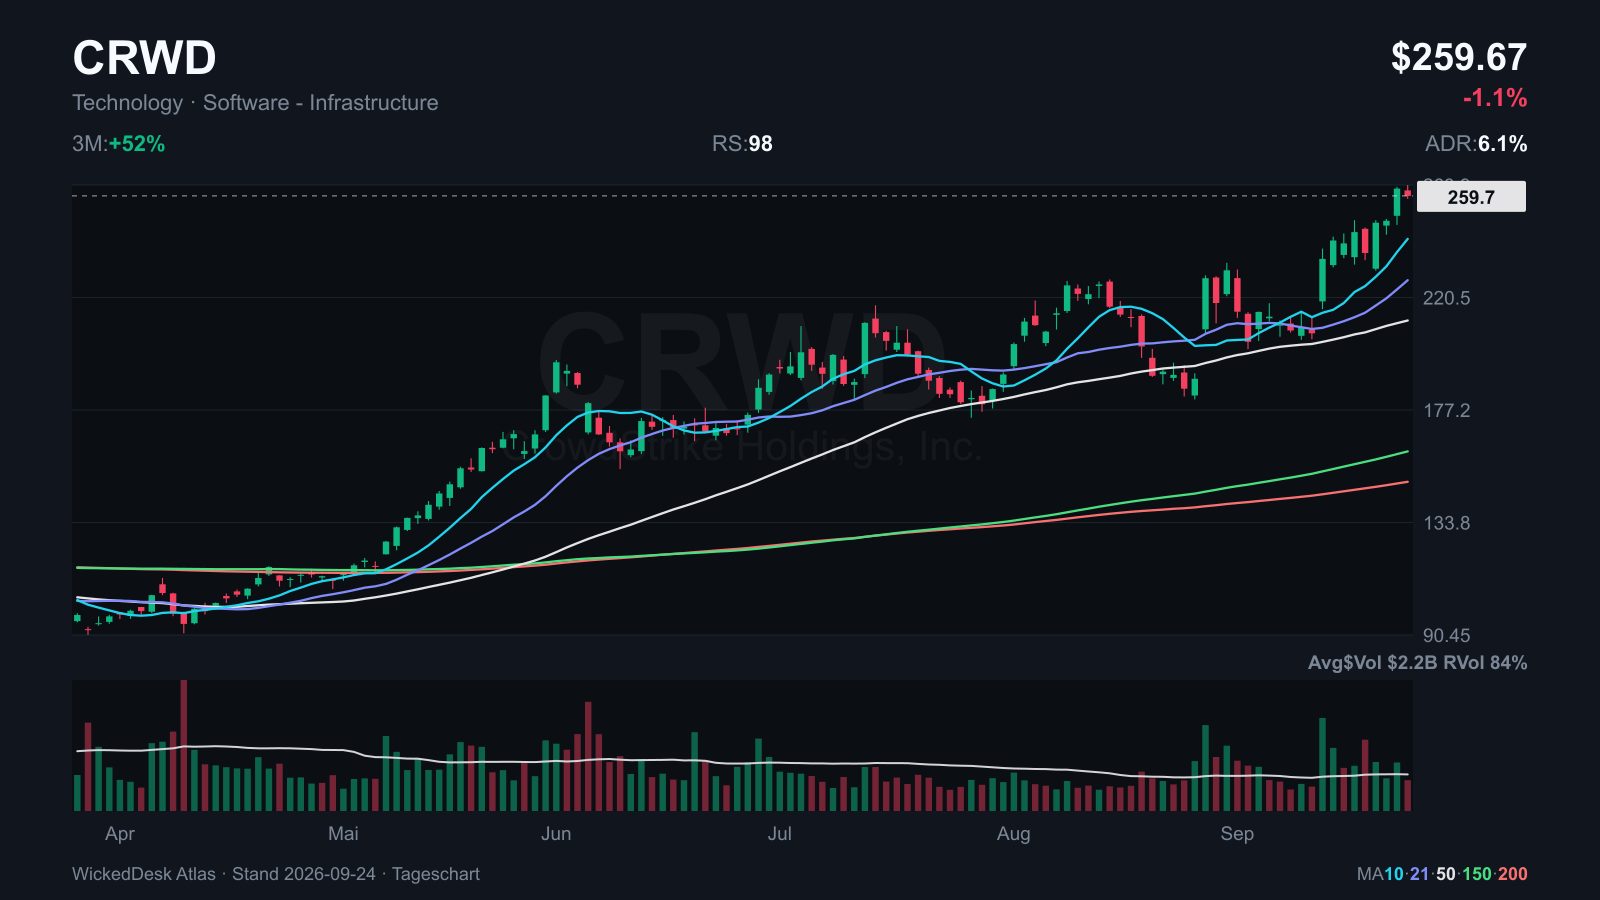
On Wednesday 811 stocks fell at least 4 percent. CRWD gained 5.0 percent the same day to $262.49 on volume 39 percent above its 50-day average. That is its highest close in at least a year. On Thursday the stock gave back 1.1 percent to $259.67 on below-average volume. RS 98, and the stock trades 14.3 percent above its 21-day line.
Relative strength on a broad selling day is the first thing we look for in a leader. Since the September 11 close of $206.74, however, CRWD has run 26 percent. Thursday's pullback on light volume is the kind of pause we are waiting for. A close below $248.51, Wednesday's low, would undo Wednesday's push.
The candidates come from the screen, not from the leader list
The leader list in the WickedDesk weekly snapshot is empty this week, so the candidates come straight from the scanner. The liquid universe covers 1,425 stocks with at least $20 million in daily dollar volume. The fixed criteria are RS of at least 90, no more than 15 percent below the 52-week high, at least 20 percent gain over three months and an average daily range of at least 3 percent. 86 stocks pass, 37 from health care, 29 from technology and 10 from energy.
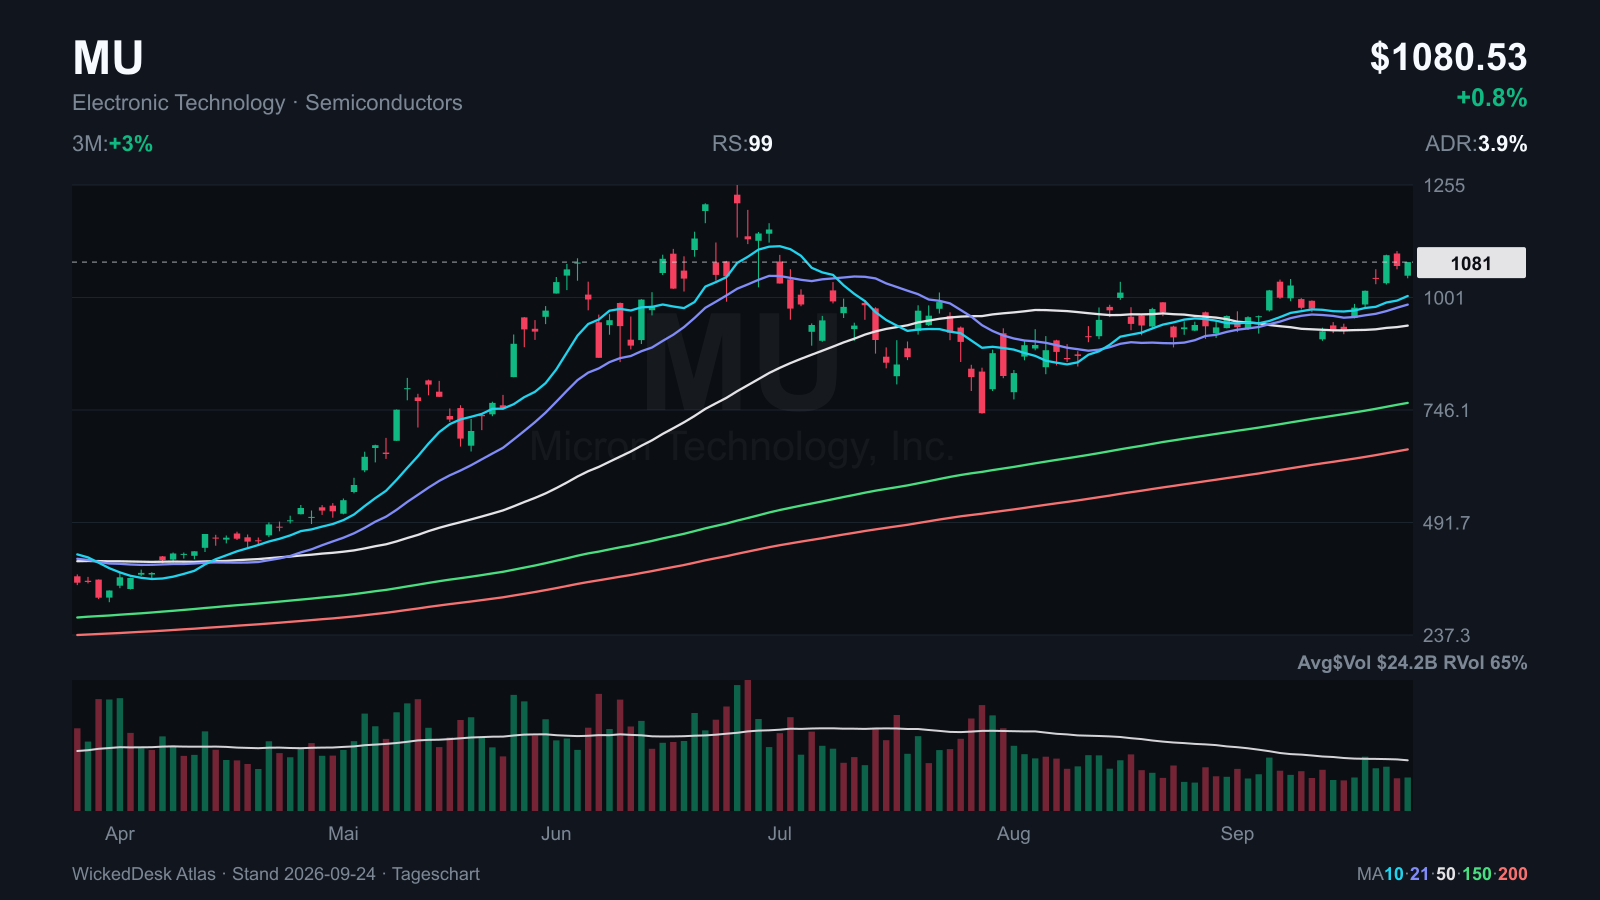
The list takes names that trade near their high, belong to a highly ranked group and held up on the weak Wednesday. Most of them come from cybersecurity and genomics. TWLO joins from communication services after gaining 23 percent in four days. MU misses the three-month criterion and is on the list only because of its report on September 30.
| Symbol | RS | ADR | Week | Group | 3 months | From high |
|---|---|---|---|---|---|---|
| CRWD | 98 | 6.1% | +9.3% | Cybersecurity | +52% | -1.6% |
| OKTA | 99 | 5.8% | +13.3% | Cybersecurity | +79% | -2.8% |
| PANW | 97 | 5.2% | +7.2% | Cybersecurity | +39% | -2.2% |
| NTRA | 98 | 3.4% | +10.7% | Genomics | +79% | -1.0% |
| CDNA | 99 | 4.6% | +14.0% | Genomics | +131% | -2.7% |
| TWLO | 93 | 4.7% | +22.9% | Communication | +54% | -1.7% |
| MRNA | 99 | 7.8% | +26.5% | Biotech | +208% | -0.5% |
| MU | 99 | 3.9% | +6.4% | Semiconductors | +3% | -13.9% |
- RS
- 98
- ADR
- 6.1%
- Week
- +9.3%
- Group
- Cybersecurity
- 3 months
- +52%
- From high
- -1.6%
- RS
- 99
- ADR
- 5.8%
- Week
- +13.3%
- Group
- Cybersecurity
- 3 months
- +79%
- From high
- -2.8%
- RS
- 97
- ADR
- 5.2%
- Week
- +7.2%
- Group
- Cybersecurity
- 3 months
- +39%
- From high
- -2.2%
- RS
- 98
- ADR
- 3.4%
- Week
- +10.7%
- Group
- Genomics
- 3 months
- +79%
- From high
- -1.0%
- RS
- 99
- ADR
- 4.6%
- Week
- +14.0%
- Group
- Genomics
- 3 months
- +131%
- From high
- -2.7%
- RS
- 93
- ADR
- 4.7%
- Week
- +22.9%
- Group
- Communication
- 3 months
- +54%
- From high
- -1.7%
- RS
- 99
- ADR
- 7.8%
- Week
- +26.5%
- Group
- Biotech
- 3 months
- +208%
- From high
- -0.5%
- RS
- 99
- ADR
- 3.9%
- Week
- +6.4%
- Group
- Semiconductors
- 3 months
- +3%
- From high
- -13.9%
Atlas: TWLO gains 23 percent in four days
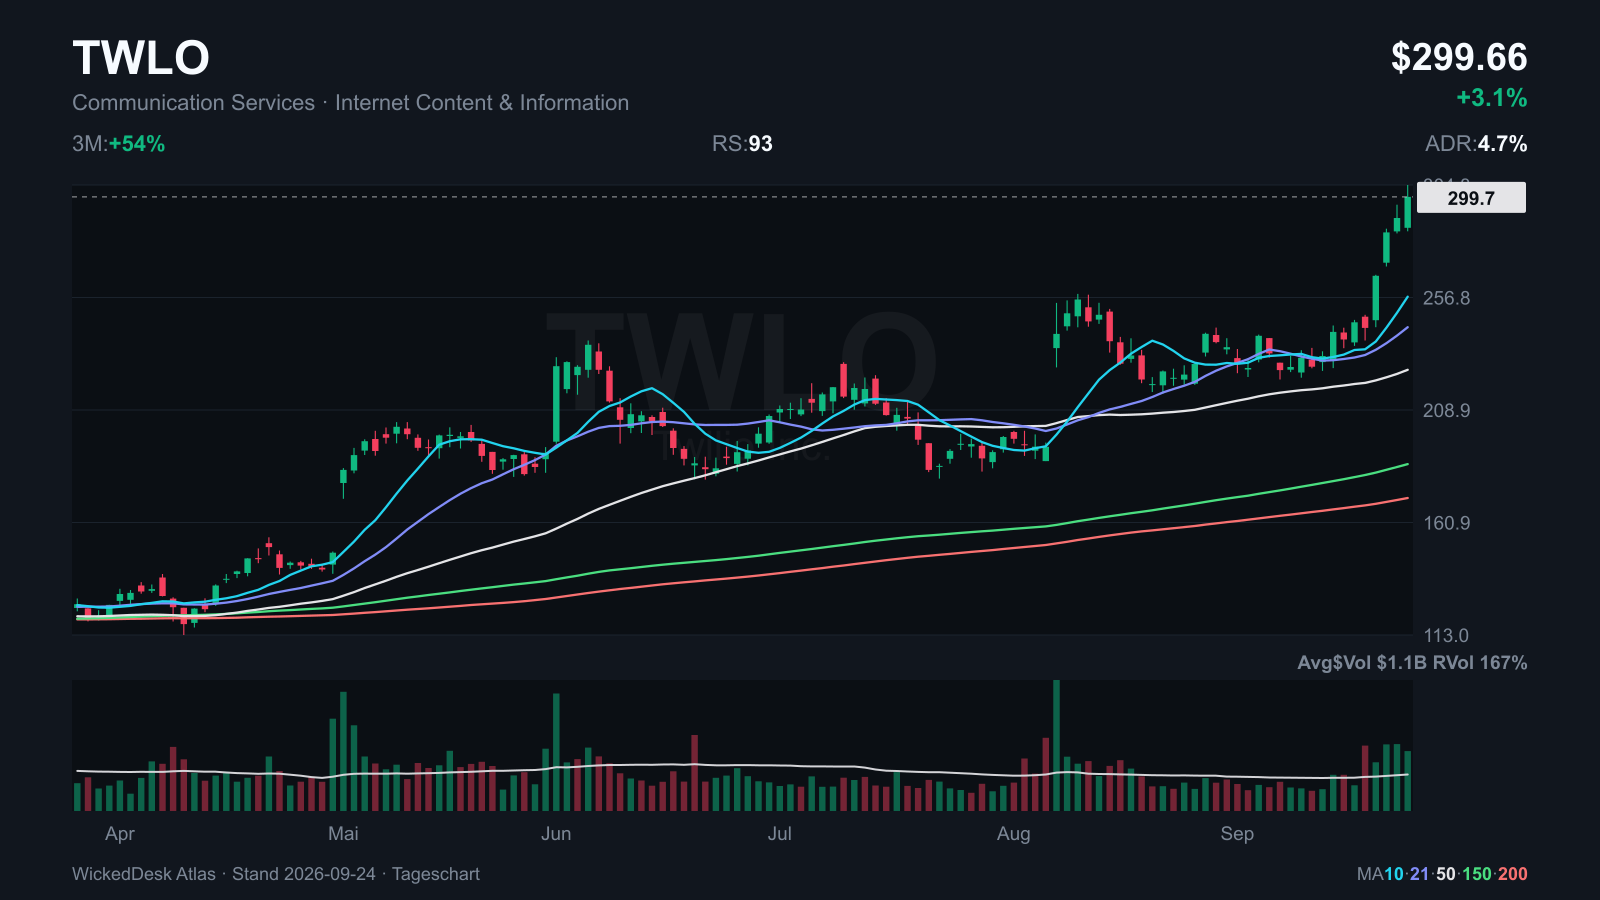
Twilio closed the prior week at $243.84 and now trades at $299.66. That is 22.9 percent in four trading days, with a new closing high on Thursday. Volume ran above the 50-day average on all four days and at roughly double on Tuesday and Wednesday. RS 93, and the stock sits 1.7 percent below its high and 32.6 percent above its 50-day line.
The SEC filing index shows no company report behind the move. After a run like this TWLO is not an entry but a candidate for the next base. We are watching for a tight range above $266, Monday's close. A drop below that close would mean the push came too fast.
Atlas: NTRA has the tightest daily range on the list
Natera set a closing high on Tuesday, held its level on Wednesday even as genomics lost 4.3 percent on average, and rose 4.6 percent to $408.79 on Thursday. Since issue 014 the stock is up 11.6 percent, RS 98. Its average daily range is 3.4 percent, the lowest of all candidates.
For the same dollar risk, the tighter range allows a larger share count than MRNA or CRWD. The stock now trades 18.1 percent above its 21-day line, so it is extended as well. We are looking for a pause above $390.79, Wednesday's close. A close below $370.64, Monday's close before Tuesday's jump, would reverse the move.
Costco shows a resilient consumer, Micron is next
After the close on Thursday Costco reported fourth quarter sales of $93.9 billion, up 11.2 percent from a year earlier. Earnings per share rose from $5.87 to $6.75. That includes a one-time benefit of $0.15 from tariff refunds, and without it EPS grew 12.4 percent. Excluding gasoline and currency, comparable sales rose 6.7 percent, driven by 3.3 percent more shopper visits and a 3.3 percent higher average ticket. 89.8 percent of members renew worldwide and 92.3 percent in the US and Canada.
The consumer keeps spending and comes in more often. So far that has not been enough for the stock. COST carries RS 37 and trades 18 percent below its high, below its 50-day and 200-day lines. A reliable price reaction only comes with regular trading. AutoZone reported 1.5 percent higher same store sales on September 22 and stays out with RS 25. Micron reports on September 30 after the close.
What Changed The Weekly Plan
Atlas: MU goes into earnings 11 percent below its June high
Micron closed at $1,080.53. Its record close from June 25 stands at $1,213.56, 11.0 percent higher. Since the September 14 low of $902.60 the stock has recovered 19.7 percent and trades 15.3 percent above its 50-day line. RS 99, but only 2.6 percent up over three months, so MU does not pass the leader screen.
The group led the week. AMD closed Thursday at $629.26, its highest level in at least a year, and is up 12.4 percent for the week, INTC 17.3 percent. Semiconductors climbed from 26th to 15th in the theme ranking. That makes MU the most important event of next week for the whole group. Before the report it is a date, not an entry. A close above $1,105.50, Wednesday's high, after the report would support the rotation into semis. A gap down below the 21-day line near $984 would put it in doubt.
Dollar firm, gold and bonds weaker
The dollar ETF UUP is up 1.1 percent this week and closed at its highest level in at least a year. The gold ETF GLD lost 2.4 percent and TLT for long Treasuries 2.3 percent. The oil ETF USO is 0.5 percent lower but swung widely, gaining 2.9 percent on Thursday alone. XLE, the ETF for large US energy companies, fell 2.7 percent.
Rising yields, a firm dollar and softer gold fit together. Oil remains a separate factor because higher energy costs feed straight into companies' input prices. Those are the prices S&P Global reported as rising at the fastest pace since October 2022.
| Week | Asset | Close |
|---|---|---|
| +1.06% | UUP (US dollar) | $28.69 |
| -2.36% | GLD (gold) | $391.69 |
| -2.25% | TLT (long Treasuries) | $79.42 |
| -0.47% | USO (oil) | $153.09 |
| -2.66% | XLE (energy stocks) | $62.60 |
- +1.06%
- Asset
- UUP (US dollar)
- Close
- $28.69
- -2.36%
- Asset
- GLD (gold)
- Close
- $391.69
- -2.25%
- Asset
- TLT (long Treasuries)
- Close
- $79.42
- -0.47%
- Asset
- USO (oil)
- Close
- $153.09
- -2.66%
- Asset
- XLE (energy stocks)
- Close
- $62.60
Bitcoin holds above $84,000, crypto stocks follow
Bitcoin closed its latest UTC daily candle at $84,410, 4.4 percent above the prior week's close and 10.5 percent above the level of issue 014. Ether stands at $2,688, 2.9 percent above the prior week. After Monday's jump both have eased slightly since Tuesday. All values are completed UTC daily candles of the spot market.
Crypto stocks moved with them. In the theme ranking blockchain gained 14.6 percent over five days and bitcoin miners 9.7 percent. COIN is up 14.5 percent since issue 014, HOOD 10.0 percent and HUT 11.6 percent. Even so COIN still trades 51 percent below its 52-week high, and both themes are negative over three months. That is a strong rebound, not new leadership yet.
These stocks stay out
CLMT is down 8.8 percent since issue 014 and trades 10 percent below its high. The energy sector lost 5.8 percent over five days. PBF lost 6.8 percent over the same period and sits 13 percent below its high. DELL gave up 4.6 percent on Tuesday and 2.5 percent on Thursday and trades 8.9 percent below its level at issue 014.
COIN rises with bitcoin but carries only RS 60 and trades 51 percent below its 52-week high. COST delivered solid numbers but carries RS 37 and trades below its 50-day and 200-day lines. Both need their own relative strength first. CLMT and PBF need a new base above the 50-day line before they return to the list.
| Symbol | RS | Close | Reason |
|---|---|---|---|
| CLMT | 98 | $53.85 | Energy falls to 4th, -8.8% since issue 014 |
| PBF | 97 | $71.90 | -6.8% since issue 014, 13% below high |
| DELL | 99 | $536.02 | Two drops this week, high not held |
| COIN | 60 | $199.21 | 51% below 52-week high |
| COST | 37 | $896.48 | Good numbers, price below 50-day and 200-day lines |
- RS
- 98
- Close
- $53.85
- Reason
- Energy falls to 4th, -8.8% since issue 014
- RS
- 97
- Close
- $71.90
- Reason
- -6.8% since issue 014, 13% below high
- RS
- 99
- Close
- $536.02
- Reason
- Two drops this week, high not held
- RS
- 60
- Close
- $199.21
- Reason
- 51% below 52-week high
- RS
- 37
- Close
- $896.48
- Reason
- Good numbers, price below 50-day and 200-day lines
What matters now and next week
Next week the weight sits on Wednesday, September 30. That day the Bureau of Economic Analysis publishes personal income and spending for August including the PCE price index, together with the third estimate of second quarter growth. Micron reports that evening.
ISM manufacturing follows on Thursday, October 1, and the September jobs report on Friday, October 2. After the strong PMI it is the most important number for yields. If the labor market stays as firm as the surveys suggest, there is little room for a quick easing in rates. All times are Eastern Time.
| Event | Date | Time | Question |
|---|---|---|---|
| Job openings, August | Sep 29 | 10:00 | How tight is the labor market? |
| PCE prices and spending for August, Q2 GDP | Sep 30 | 8:30 | How high is core inflation? |
| Micron quarterly results | Sep 30 | after close | Can memory carry the semis rotation? |
| ISM manufacturing, September | Oct 1 | 10:00 | Does ISM confirm the strong PMI? |
| Jobs report, September | Oct 2 | 8:30 | How strong is hiring? |
| Marvell investor day | Oct 6 | open | How large is the backlog for AI infrastructure? |
- Job openings, August
- Date
- Sep 29
- Time
- 10:00
- Question
- How tight is the labor market?
- PCE prices and spending for August, Q2 GDP
- Date
- Sep 30
- Time
- 8:30
- Question
- How high is core inflation?
- Micron quarterly results
- Date
- Sep 30
- Time
- after close
- Question
- Can memory carry the semis rotation?
- ISM manufacturing, September
- Date
- Oct 1
- Time
- 10:00
- Question
- Does ISM confirm the strong PMI?
- Jobs report, September
- Date
- Oct 2
- Time
- 8:30
- Question
- How strong is hiring?
- Marvell investor day
- Date
- Oct 6
- Time
- open
- Question
- How large is the backlog for AI infrastructure?
The list for Monday
The three cybersecurity names lead. OKTA closed at a new high, CRWD is taking a first pause after its one-year high, and PANW sits 1.5 percent below its August 13 closing high. NTRA and CDNA represent genomics, the strongest group in the theme ranking. TWLO and MRNA are candidates for the next base after their runs, not for an entry on Monday. MRVL stays open until volume arrives. MU is a date, not a setup.
The order of the check stays the same as in issue 014. Breadth first, then the group, then the chart. As long as two thirds of stocks trade below their 50-day line, the list stays short.
| Symbol | RS | Role | Check | From high |
|---|---|---|---|---|
| CRWD | 98 | Cybersecurity leader | Pause above $248.51 | -1.6% |
| OKTA | 99 | Cybersecurity, new high | Pause above $196 | -2.8% |
| PANW | 97 | Cybersecurity, liquid | Close above $398.88 on volume | -2.2% |
| NTRA | 98 | Genomics, tightest range | Pause above $390.79 | -1.0% |
| CDNA | 99 | Genomics, breakout | Pause above $57 | -2.7% |
| TWLO | 93 | Communication, strong push | Tight range above $266 | -1.7% |
| MRNA | 99 | Biotech, breakout done | Pause above $172.94 | -0.5% |
| MRVL | 98 | Semis, volume missing | Above $266 on more than 23.5M shares | -21.5% |
| MU | 99 | Semis, reports Sep 30 | Reaction to the report | -13.9% |
- RS
- 98
- Role
- Cybersecurity leader
- Check
- Pause above $248.51
- From high
- -1.6%
- RS
- 99
- Role
- Cybersecurity, new high
- Check
- Pause above $196
- From high
- -2.8%
- RS
- 97
- Role
- Cybersecurity, liquid
- Check
- Close above $398.88 on volume
- From high
- -2.2%
- RS
- 98
- Role
- Genomics, tightest range
- Check
- Pause above $390.79
- From high
- -1.0%
- RS
- 99
- Role
- Genomics, breakout
- Check
- Pause above $57
- From high
- -2.7%
- RS
- 93
- Role
- Communication, strong push
- Check
- Tight range above $266
- From high
- -1.7%
- RS
- 99
- Role
- Biotech, breakout done
- Check
- Pause above $172.94
- From high
- -0.5%
- RS
- 98
- Role
- Semis, volume missing
- Check
- Above $266 on more than 23.5M shares
- From high
- -21.5%
- RS
- 99
- Role
- Semis, reports Sep 30
- Check
- Reaction to the report
- From high
- -13.9%
Risk in bundles: two groups carry the list
CRWD, OKTA and PANW belong to the same group and rose almost in lockstep on Wednesday. NTRA and CDNA jumped on Thursday together with the whole genomics group. One weak headline from either industry would hit several positions at once. Anyone holding more than one name from a group should treat the positions as a single one.
Daily ranges run from 3.4 percent for NTRA to 7.8 percent for MRNA. For the same dollar risk to the stop, MRNA means a much smaller share count. Rate risk comes on top. If the ten-year yield keeps rising, richly valued growth stocks take the biggest hit, and that is exactly what this list consists of. Small positions and only the clearest setups are the rule in this environment. Gaps after earnings or news can fill orders far from the planned stop.
Records on top, pressure underneath
This week shows two markets at the same time. On top sit Nasdaq records built on semiconductors, software and cybersecurity, plus a fresh push in genomics. Underneath, 811 stocks fell at least 4 percent in a single day, the ten-year yield reached 5.18 percent and the mortgage rate 7 percent. Both are true, and neither cancels the other.
For preparation that means keeping the list short and only looking at stocks that rise on days like this Wednesday. Those were CRWD, OKTA and PANW, and the genomics names joined on Thursday. As long as the yield stays above 5 percent, the group matters more than the index.