
The fuel bill is rising again
Anyone who filled up in the US during September has already experienced a large part of this inflation report. Gasoline prices rose 9.1% in a month. Meanwhile, chip companies report record revenue and several of their stocks fall. That is the difficult combination this week. Businesses are making substantial profits, but investors are becoming less willing to pay any price for them.
Friday brings stronger industrial production after Thursday's sharp increase in producer prices. Tesla unveils its new Roadster. For investors, the question remains which companies turn higher revenue into higher profit. The stocks from issue 017 stay in the comparison, including the losers.
The price snapshots are from Friday, 16 October, retrieved at 19:22 CEST during US trading. They are not Friday closing prices. Weekly comparisons begin at the 9 October close. Older economic releases and completed earnings reactions carry their own dates.
Nasdaq falls faster than the broad market
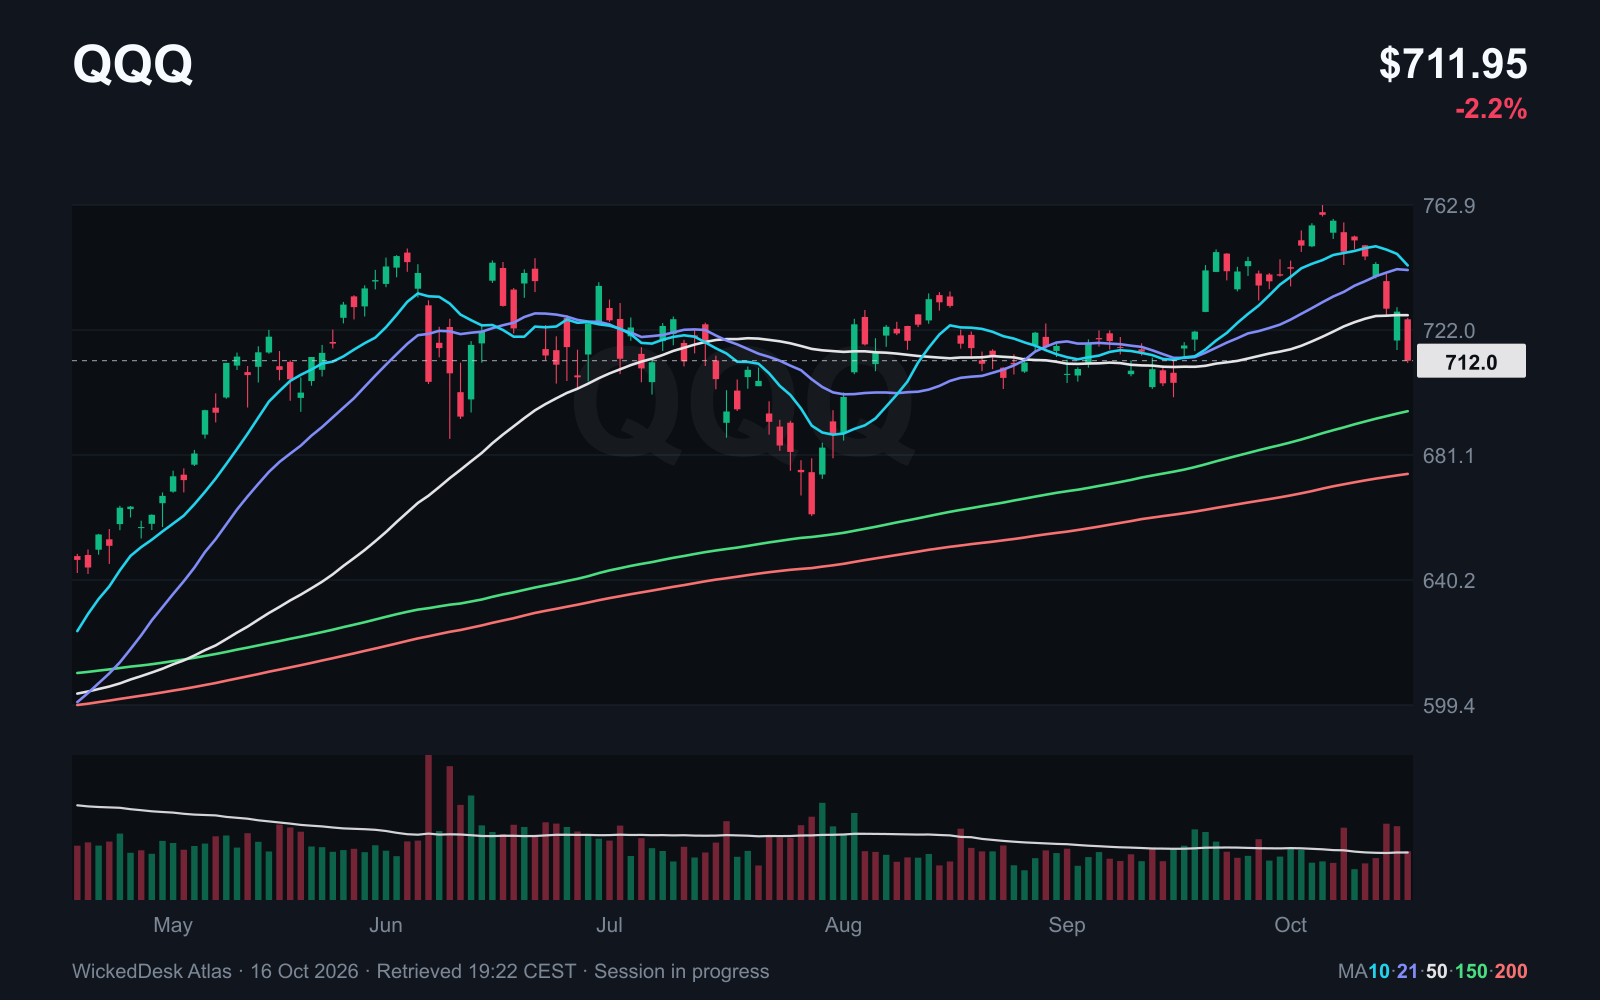
QQQ, which we use to track the Nasdaq 100, loses 5.23% since the 9 October close. It trades at USD 711.95 on Friday, down 2.20% from Thursday. Price is now below both the 21 day average and the 50 day average at USD 726.82. It remains above the 200 day average at USD 674.92, but the shorter term trend has weakened considerably.
SPY, tracking the S&P 500, loses 1.98% over the week. IWM, representing smaller US companies, falls 3.04% and already trades below its 200 day average. The Dow ETF DIA holds up better with a 0.39% gain. A relatively resilient Dow offers little comfort if your portfolio is concentrated in weak technology stocks.
The table shows ETF prices in dollars, not index levels. It compares the 9 October close with Friday afternoon's snapshot and excludes distributions.
| Symbol | SMA 21 | SMA 50 | SMA 200 | Price USD | Since 9 October |
|---|---|---|---|---|---|
| SPY | 770.73 | 768.50 | 725.01 | 763.12 | -1.98 % |
| QQQ | 741.62 | 726.82 | 674.92 | 711.95 | -5.23 % |
| IWM | 279.54 | 289.07 | 277.65 | 270.45 | -3.04 % |
| DIA | 514.66 | 524.18 | 504.32 | 518.12 | +0.39 % |
- SMA 21
- 770.73
- SMA 50
- 768.50
- SMA 200
- 725.01
- Price USD
- 763.12
- Since 9 October
- -1.98 %
- SMA 21
- 741.62
- SMA 50
- 726.82
- SMA 200
- 674.92
- Price USD
- 711.95
- Since 9 October
- -5.23 %
- SMA 21
- 279.54
- SMA 50
- 289.07
- SMA 200
- 277.65
- Price USD
- 270.45
- Since 9 October
- -3.04 %
- SMA 21
- 514.66
- SMA 50
- 524.18
- SMA 200
- 504.32
- Price USD
- 518.12
- Since 9 October
- +0.39 %
Energy and consumer staples hold up better
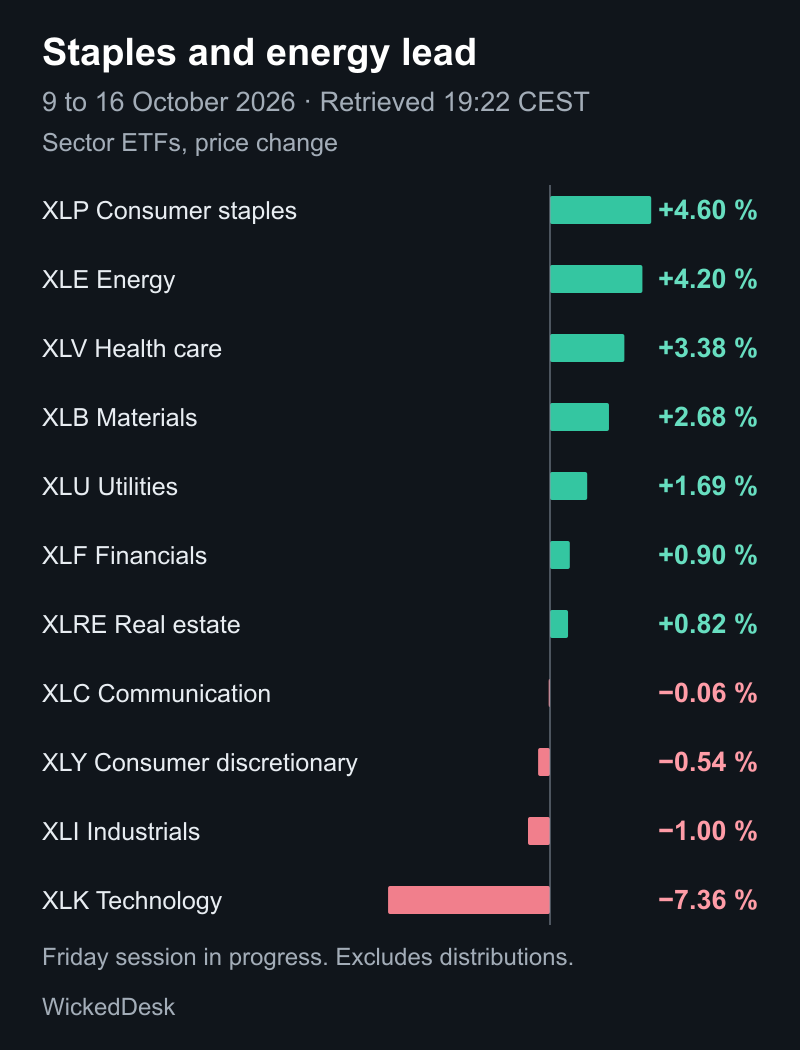
XLP gains 4.60% over the week, XLE rises 4.20% and XLV advances 3.38%. Consumer staples, energy and healthcare are well ahead of technology. The technology ETF XLK loses 7.36%. The gap between energy and technology amounts to 11.56 percentage points.
Higher energy prices offer a plausible explanation for interest in oil companies. The strength in staples and healthcare is consistent with investors preferring less cyclical businesses. Prices alone cannot establish individual buying motives, though. The graphic compares sector ETFs, not equally weighted stock groups.
XLE trades at USD 67.82, close to its 52 week high of USD 67.91. Anyone researching individual energy stocks needs to account for how far prices have already moved. The relative strength would become less convincing if energy started lagging the broad market again. The individual chart still determines whether there is a reasonable entry.
Gasoline lifts inflation to 3.7%
The consumer price report released on 14 October shows an annual increase of 3.7% in September, up from 3.4% in August. The seasonally adjusted monthly increase is 0.6%. Gasoline rises 9.1%, accounting for more than half of that monthly increase.
Excluding food and energy, the annual rate is 2.6% and the monthly increase is 0.3%. Food prices are unchanged overall from August. The report does not support a claim that every category is suddenly becoming more expensive at the same pace.
Thursday's producer prices add to the pressure. They rise 1.3% in September from August and 6.3% from a year earlier. Energy increases 10.8% in this report. Even excluding food, energy and trade services, the monthly increase is 0.5%. That does not prove consumer prices will subsequently rise by the same amount. Companies may pass costs on or absorb some through lower margins.
Households have less left when filling up costs more. For businesses, the effect depends on customers accepting higher prices. The next reports therefore need to explain what is happening to sales volumes and profit, not just revenue growth.
Higher sales do not always mean stronger demand
US retail sales, released on Thursday, rise 0.8% in September to USD 745bn. Excluding gas stations, the monthly increase is only 0.2%. These figures are not adjusted for inflation. A larger receipt does not necessarily mean more goods were sold.
Friday's industrial production report offers a different perspective. Output rises 0.7% in September, with manufacturing up 0.3%. Utilities increase 3.5%, while motor vehicles and parts fall 3.0%. Capacity utilisation is 76.9%, still below its long term average. Production is growing, but the improvement is not uniform across industries.
J.B. Hunt shows why the details matter. On Thursday evening, the transport company reports quarterly revenue of USD 3.68bn, up 20% from a year earlier. Excluding fuel surcharges, growth is 13%. Operating profit rises only 2%, and operating margin falls from 7.9% to 6.7%. Earnings per share are USD 1.82, compared with USD 1.76. JBHT is down 3.70% in Friday afternoon's snapshot. Higher revenue alone has not been enough.
Lower oil demand does not fix supply shortages
In its October report, the IEA expects global oil demand to fall by 2.6 million barrels per day in 2026, to an average of 102.4 million barrels. High fuel prices and a weaker economy reduce consumption. Supply remains constrained at the same time. Falling demand and high prices can coexist in these conditions.
In its 6 October forecast, the US Energy Information Administration projects average Brent prices of USD 105 a barrel in the fourth quarter. That is a quarterly forecast, not a current market quote. It puts September US retail diesel prices at an average of USD 6.29 a gallon. East Coast distillate inventories ended September 32% below their seasonal five year average.
Refining capacity can therefore also matter for airlines, transport operators and industrial companies. Cheaper crude does not guarantee an equally rapid fall in diesel prices. A more convincing improvement would involve rising deliveries and product inventories, together with lower premiums on finished fuels.
European and US gas need separate treatment
The EIA expects US gas inventories to enter winter 2% above their five year average. It forecasts a 2026 annual average Henry Hub price of USD 3.48 per million British thermal units. That annual forecast is neither today's price nor a description of conditions at Europe's TTF trading hub.
Europe depends more heavily on obtaining enough liquefied natural gas by ship. Liquefaction, transport and regasification stand between American production and European supply. Abundant US gas therefore does not automatically translate into cheap gas in Europe.
Supply capacity is growing over a longer horizon. The IEA tracks more than 330 billion cubic metres of additional annual LNG export capacity due between 2025 and 2030 from projects already under construction in 2025. It does not arrive all at once. Delays and outages can postpone relief. For European chemical producers and other large gas users, actual procurement prices and the duration of their hedges remain important.
Financing costs remain a constraint
On 16 September, the Fed raised its target range. The previous range was 3.50% to 3.75%; the new range is 3.75% to 4.00%. The ECB's deposit rate increased from 2.25% to 2.50%, effective 16 September. These are earlier decisions, not new policy moves this week. The latest inflation report mainly complicates hopes for a quick reversal.
The latest available FRED daily reading puts the US ten year Treasury yield at 5.19% on 14 October, compared with 5.24% on 9 October. That is not a Friday quote. The level remains high even though it fell slightly over that comparison. Existing fixed coupon bonds generally lose value when market yields rise. Longer maturities can make that price sensitivity larger.
Companies do not all feel higher financing costs at the same time. A long term fixed rate loan does not become more expensive immediately. Refinancing, new projects and floating rate borrowing are more exposed. A space company funding development faces a different situation from a business able to finance expansion from current operating cash flow.
Higher rates do not instantly shrink the money supply
The ECB's latest published monetary data cover August. Broad money, M3, grows 3.5% from a year earlier, compared with 3.4% in July. Corporate lending grows 4.2% and household lending 3.1%. The figures were released on 25 September. They describe the month before the latest rate increase and cannot yet show its effect.
Higher interest rates can reduce demand for new loans and make saving more attractive. Banks do not pass the increase on to every depositor equally quickly. Existing loans continue, and other financial flows change too. The money supply does not automatically shrink as soon as a central bank raises its rate.
For the economy, what matters is which investments are cancelled and which companies still find demand despite higher financing costs. The next lending reports will be more useful than a blanket claim that liquidity is being withdrawn everywhere.
TSMC beats its own revenue guidance
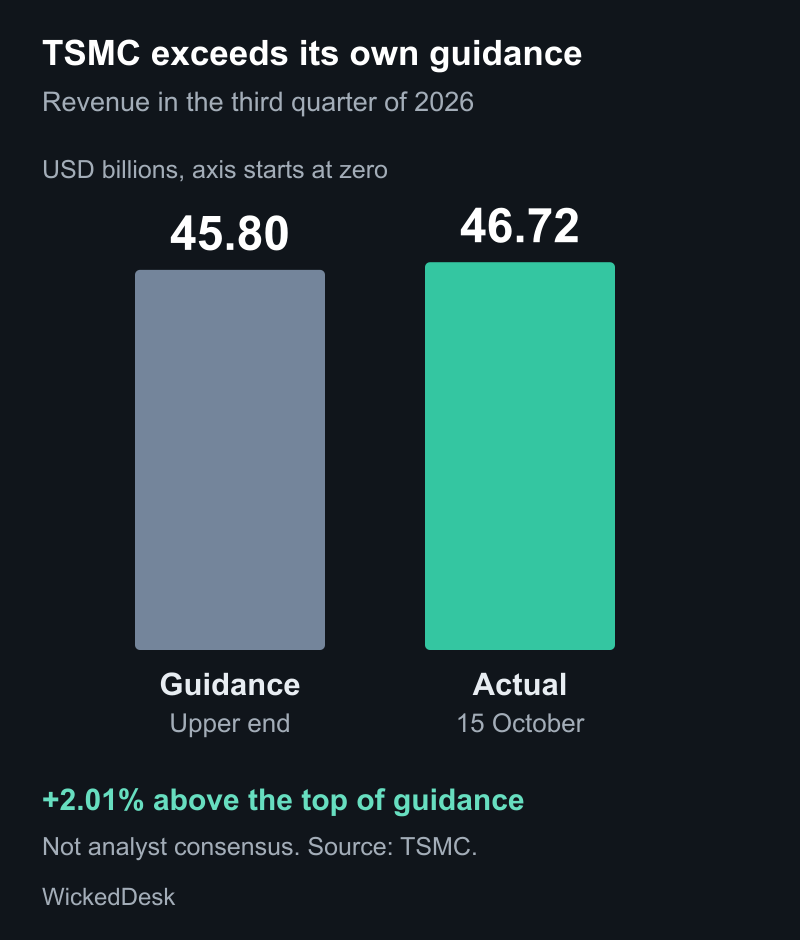
TSMC reports third quarter revenue of USD 46.72bn on Thursday morning. That is up 41.2% from a year earlier and 16.2% from the second quarter. Its own guidance was USD 44.6bn to USD 45.8bn, so the result exceeds even the upper end by about 2%. This is a comparison with company guidance, not analyst consensus.
Gross margin reaches 66.4%. Diluted earnings are equivalent to USD 4.60 per American depositary receipt, or ADR. The figures show how much revenue and profit the chipmaker earns. They do not answer whether customers will also earn enough from their investments. That question from issue 017 remains relevant to the continuing AI buildout.
ASML reported EUR 11.66bn in revenue, EUR 4.96bn in net income and a 57.5% gross margin on Wednesday. It guides fourth quarter revenue to EUR 14.2bn to EUR 15.2bn. Its US traded stock nevertheless falls 3.94% on the reporting day.
TSMC's first completed US session after its report is now available too. TSM opens Thursday 3.45% below the previous close, recovers during the session and still closes 1.80% lower at USD 422.25. Friday afternoon's snapshot puts it at USD 412.67. Strong business results and a weak share price are not contradictory data. Price also reflects the expectations investors had already paid for.
Tesla shows the Roadster. Earnings are still to come
Tesla unveiled its new Roadster on Thursday. The product page describes active aerodynamics, a suction system for additional downforce and cold gas thrusters. Tesla claims the Thrust variant accelerates from zero to 60 miles per hour in less than one second. That is a manufacturer claim, not an independent test.
Tesla says the single seat Rocket variant can also generate upward thrust. It is explicitly not approved for public road use. The demonstration establishes neither a firm production ramp nor a material earnings contribution next quarter. The official product page provides no specific timetable for that.
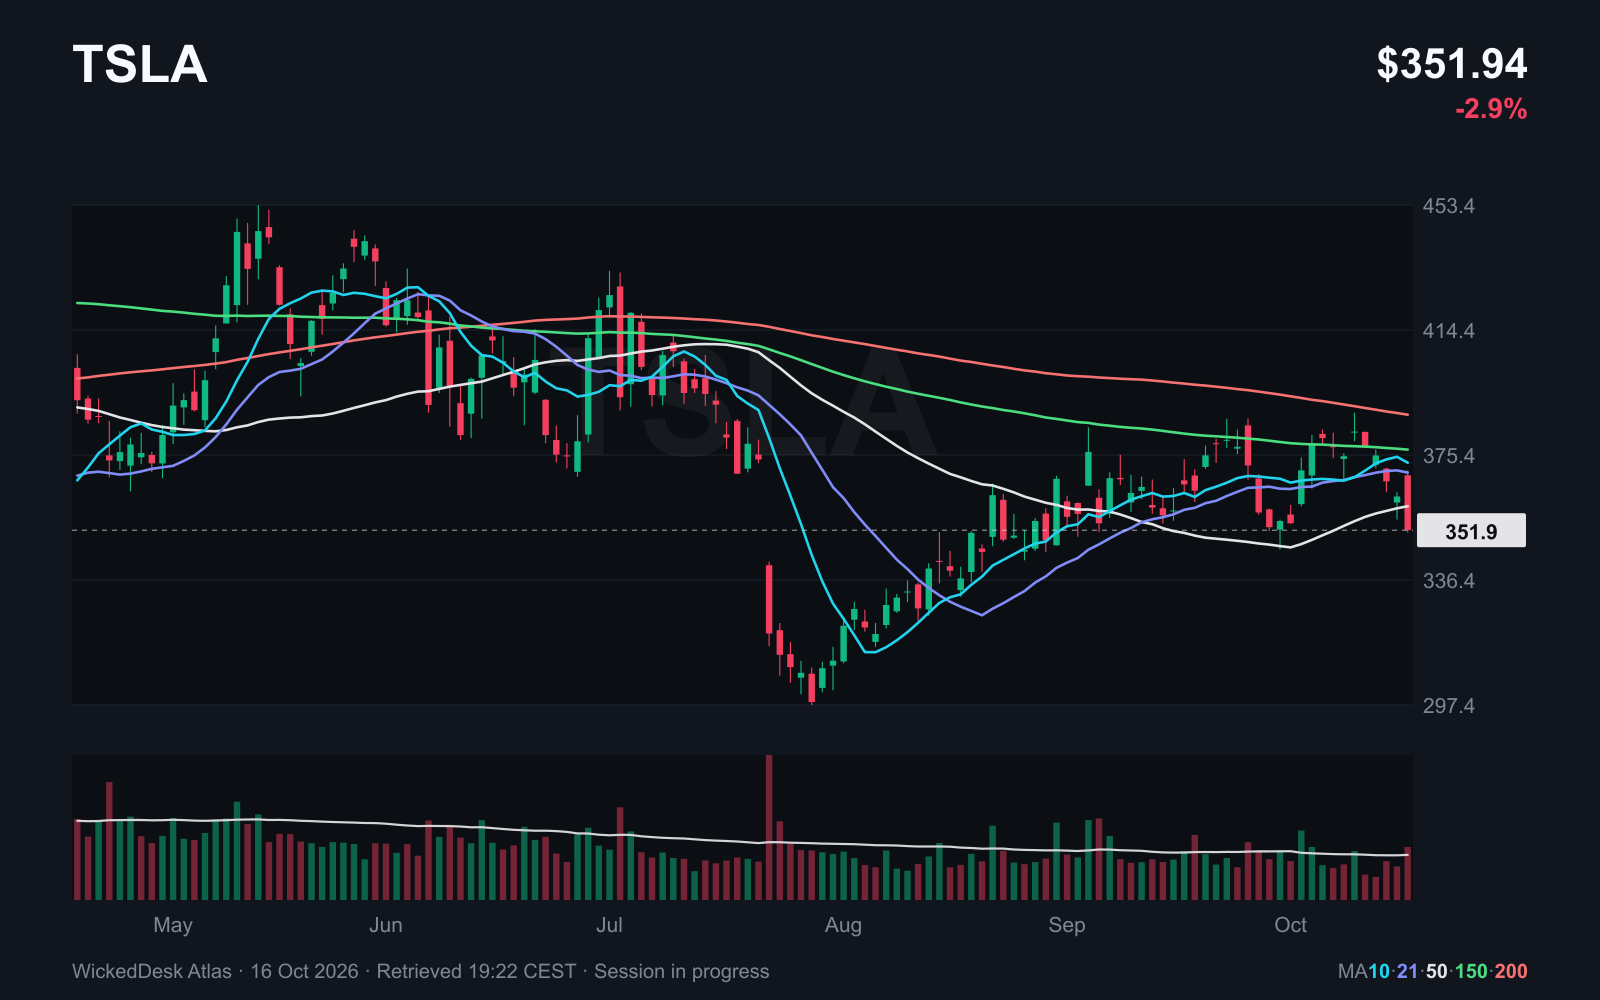
The stock market response is more restrained. TSLA opens Friday at USD 369.04, about 1.82% above Thursday's close, but trades at USD 351.94 in our snapshot. That is a 2.90% decline from Thursday. Price sits below its 21, 50 and 200 day averages.
Quarterly earnings follow on 21 October. The company has already reported deliveries of 486,532 vehicles and energy storage deployments of 13.7 gigawatt hours. What remains after costs and investment will matter. A spectacular new car does not answer that question.
What happened to last issue's stocks
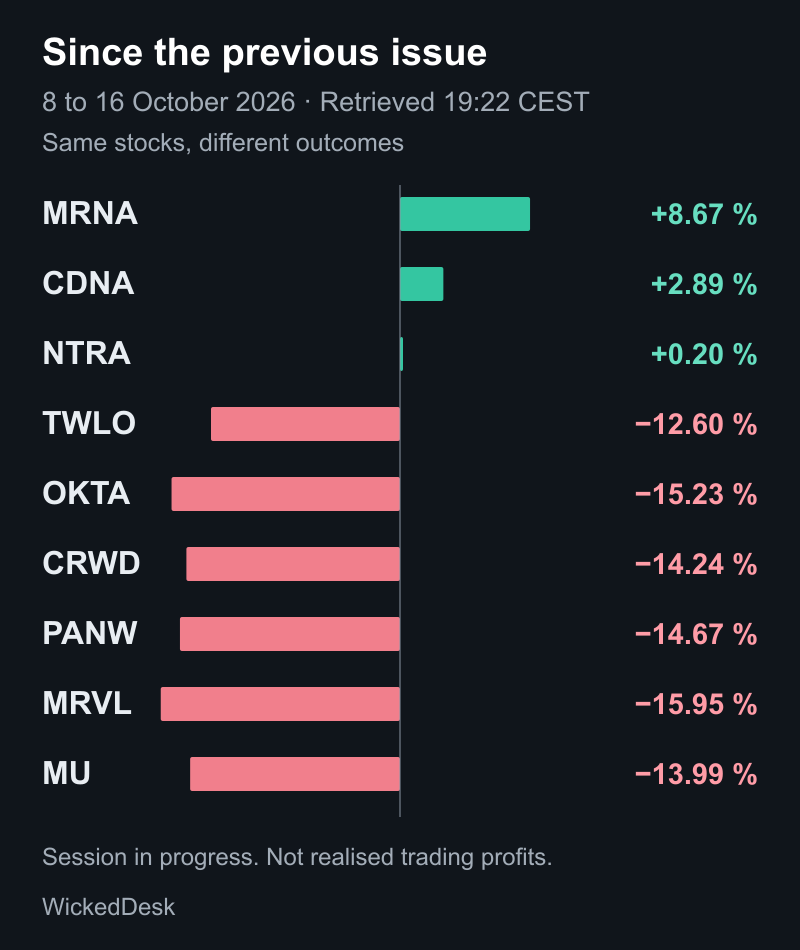
MRNA and MU have developed very differently since our previous review. Moderna remains 8.67% above the 8 October close used in issue 017. Micron loses 13.99% and Marvell falls 15.95%. Friday's selling also hits Moderna. The earlier observations stay in the record rather than disappearing from the list.
This comparison deliberately starts on 8 October because that closing price was the basis of the previous issue. Its starting point differs from the sector comparison. A positive move since then is neither evidence of a trade nor a realised return.
| Symbol | Read | Price USD | Since 8 October |
|---|---|---|---|
| MRNA | Sharp pullback, still above 21 day average | 214.08 | +8.67 % |
| CDNA | Above 21, 50 and 200 day averages | 64.00 | +2.89 % |
| NTRA | Below 21 day average, above 50 day average | 391.58 | +0.20 % |
| TWLO | Below 21 and 50 day averages | 241.01 | -12.60 % |
| OKTA | Below 21 day average, above 50 day average | 186.68 | -15.23 % |
| CRWD | Below 21 and 50 day averages | 225.56 | -14.24 % |
| PANW | Below 21 and 50 day averages | 340.05 | -14.67 % |
| MRVL | Below prior area around 265.79 and 50 day average | 230.86 | -15.95 % |
| MU | Below 21 and 50 day averages | 890.97 | -13.99 % |
- Read
- Sharp pullback, still above 21 day average
- Price USD
- 214.08
- Since 8 October
- +8.67 %
- Read
- Above 21, 50 and 200 day averages
- Price USD
- 64.00
- Since 8 October
- +2.89 %
- Read
- Below 21 day average, above 50 day average
- Price USD
- 391.58
- Since 8 October
- +0.20 %
- Read
- Below 21 and 50 day averages
- Price USD
- 241.01
- Since 8 October
- -12.60 %
- Read
- Below 21 day average, above 50 day average
- Price USD
- 186.68
- Since 8 October
- -15.23 %
- Read
- Below 21 and 50 day averages
- Price USD
- 225.56
- Since 8 October
- -14.24 %
- Read
- Below 21 and 50 day averages
- Price USD
- 340.05
- Since 8 October
- -14.67 %
- Read
- Below prior area around 265.79 and 50 day average
- Price USD
- 230.86
- Since 8 October
- -15.95 %
- Read
- Below 21 and 50 day averages
- Price USD
- 890.97
- Since 8 October
- -13.99 %
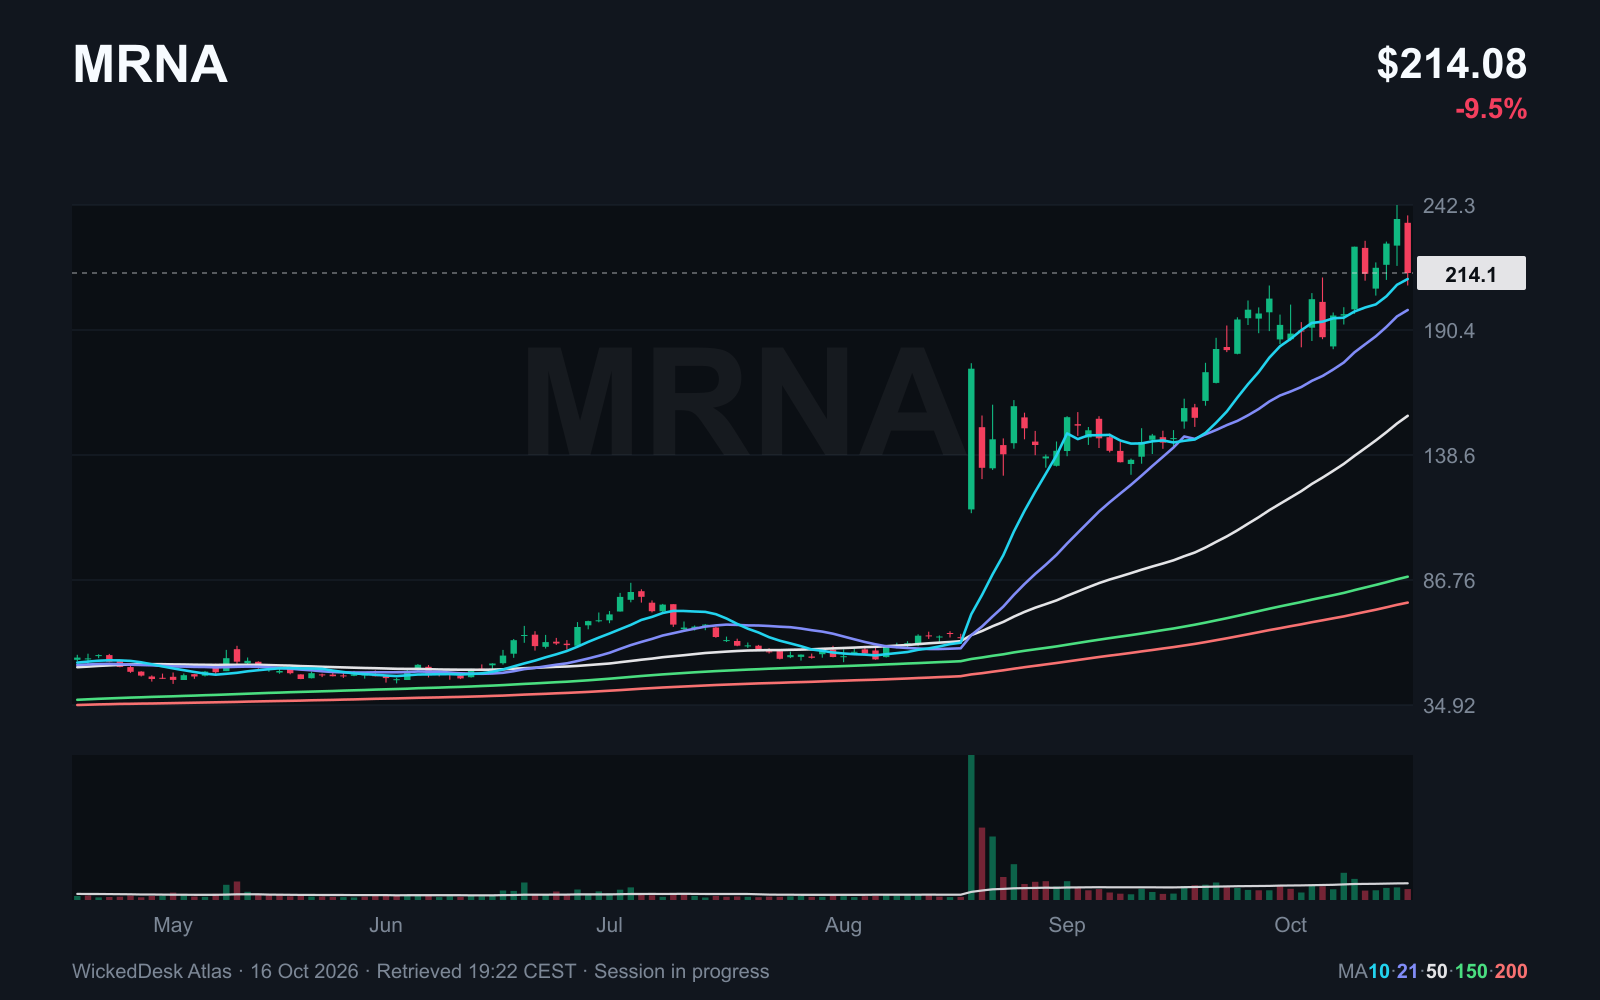
Moderna gives back part of its recent advance
MRNA reaches USD 242.29 on Thursday. By Friday afternoon, it trades at USD 214.08, down 9.48% from Thursday's close. Trading near the yearly high has turned into a substantial pullback within one session. The stock is now down 4.85% over the week.
The 21 day average at USD 198.74 and the longer averages remain below price. That still distinguishes Moderna from many weaker stocks. This sharp decline is not a tight consolidation, though. Friday's volume remains incomplete during trading and is not compared here with a full session.
I would first watch where the decline stops and whether a recognisable base develops afterwards. Its earlier relative strength is a reason to keep following it, not to dismiss today's loss.
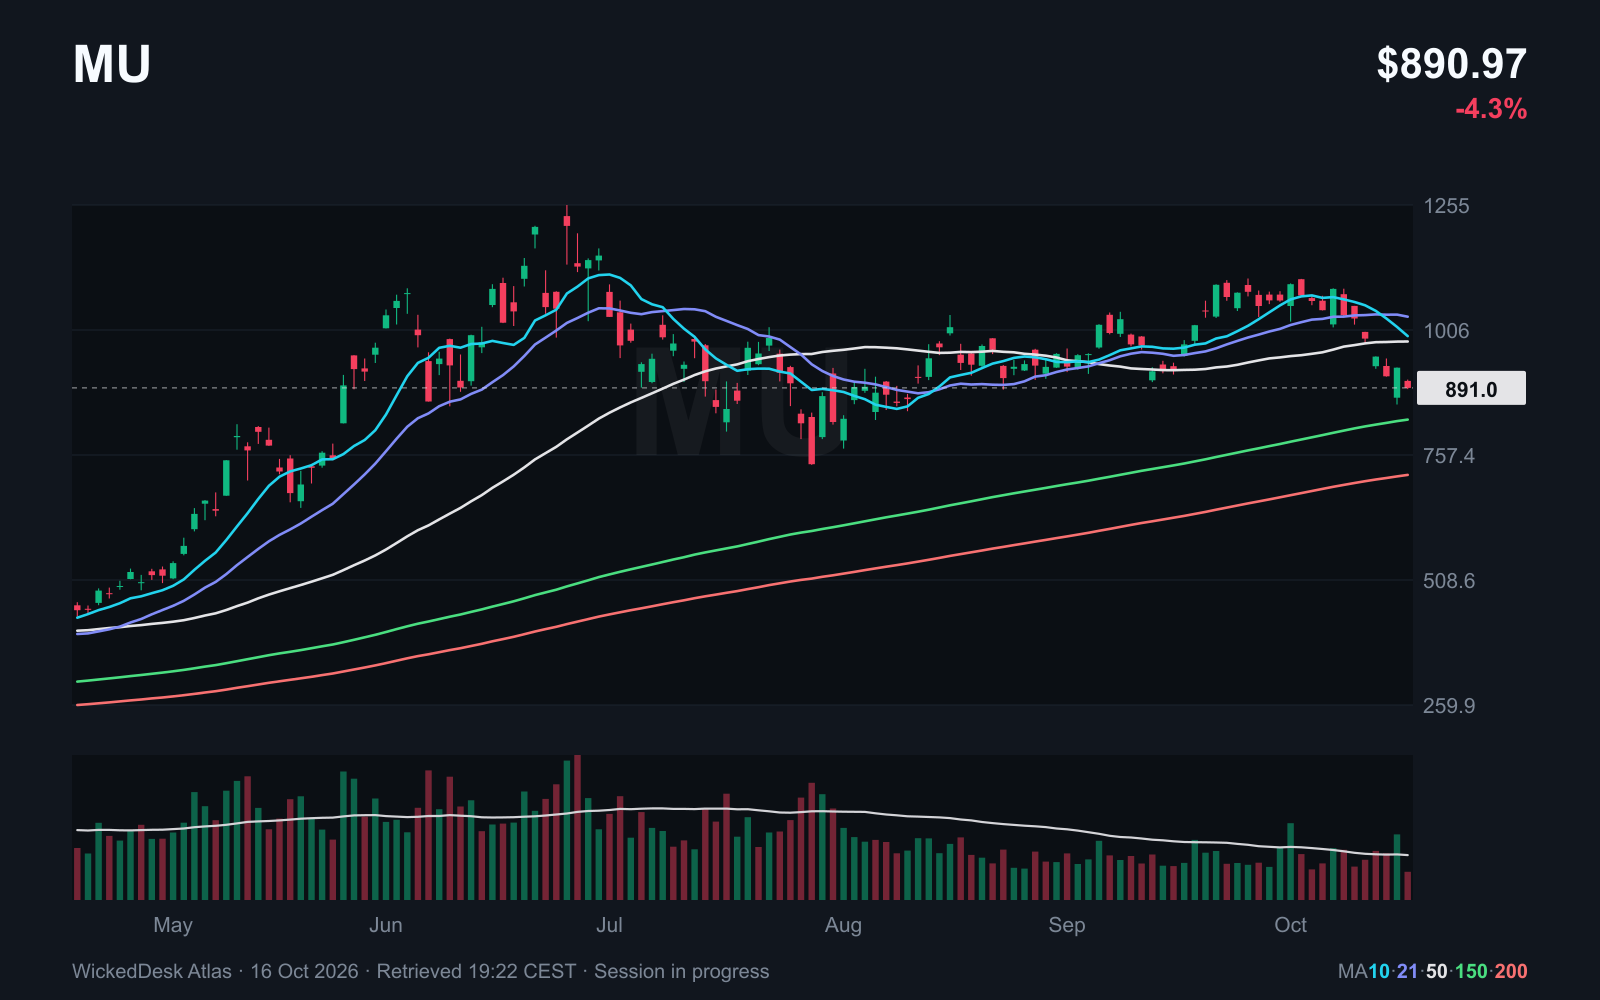
Micron drops below its 50 day average
MU trades at USD 890.97, below its 21 day average of USD 1,032.76 and its 50 day average of USD 983.36. The close used in issue 017 was USD 1,035.84. The recovery we were watching did not continue.
The stock remains above its 200 day average at USD 717.90. That does not make the shorter term decline irrelevant. In our approach, the 200 day average is an initial trend filter, not a guarantee of a good entry. MRVL has also fallen below its earlier area around USD 265.79.
Both stocks first need to stabilise again. For Micron, recovering the 50 day average would be progress. While price remains below it, the earlier idea of an immediate continuation higher no longer fits the chart.
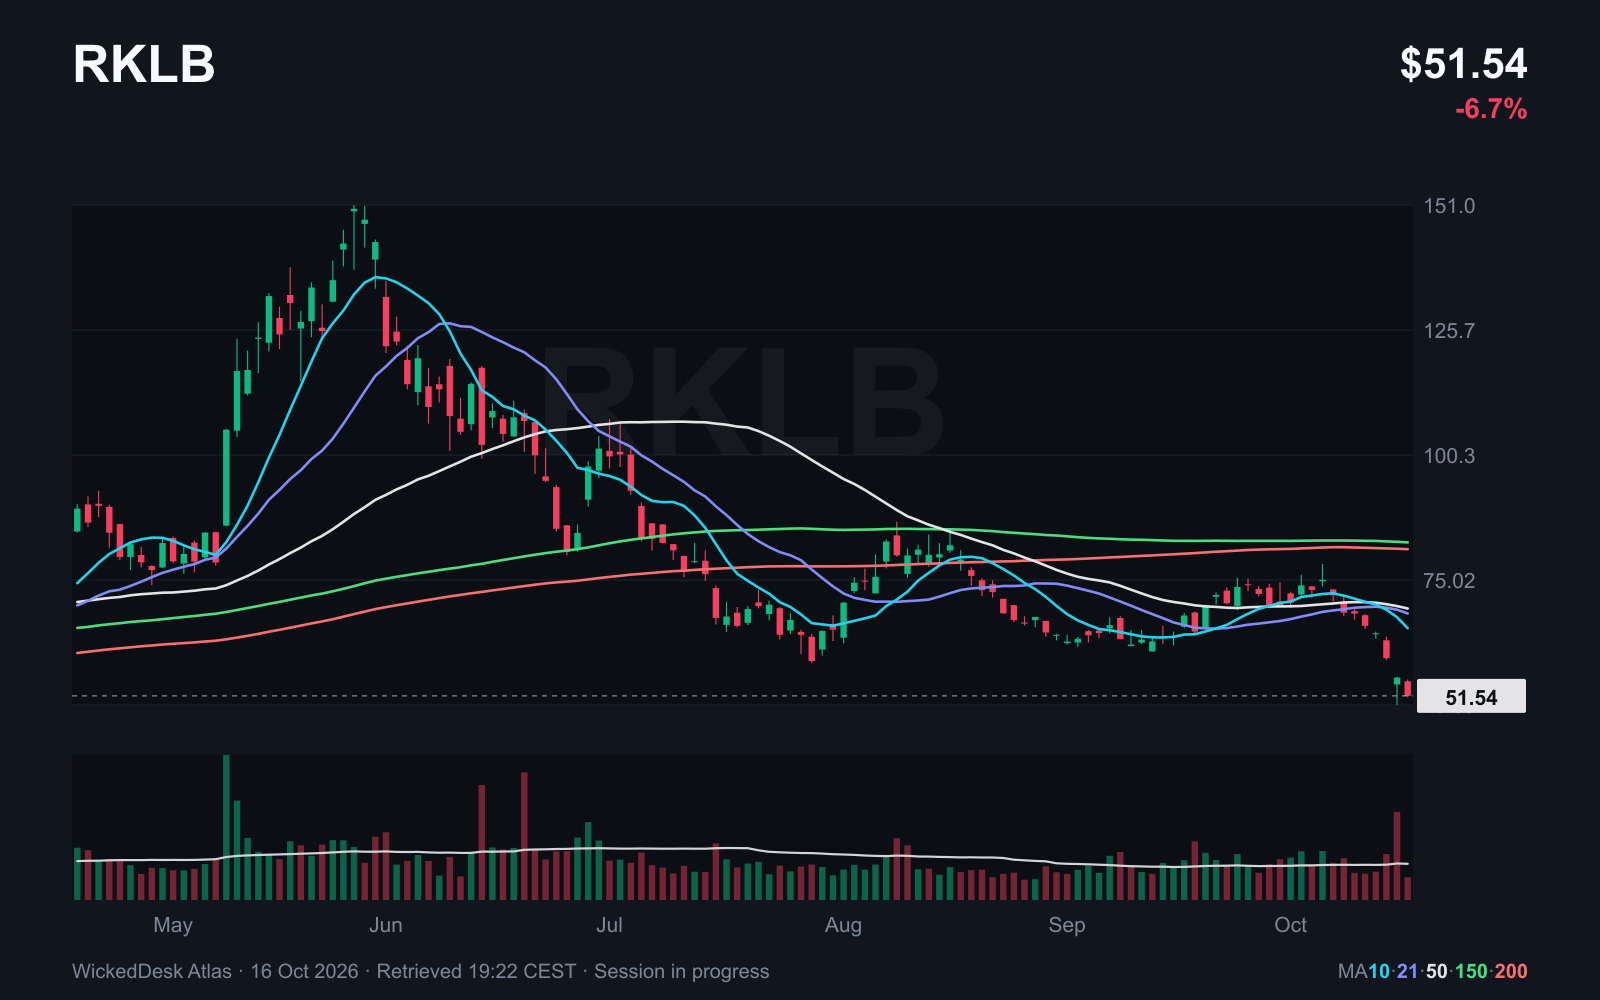
Rocket Lab moves Neutron's first launch to 2027
On 14 October, Rocket Lab says Neutron's first launch is now expected in 2027. RKLB falls 7.85% that day to USD 59.18. By Friday afternoon, it trades at USD 51.54. The decline since 9 October reaches 24.44%. Price is below its 21, 50 and 200 day averages.
Separately, the company announced 20 additional Electron missions for Synspective on 30 September. They are scheduled for 2028 through 2031, with financial terms undisclosed. Electron and Neutron are different programmes. One programme's order wins do not remove the other's development risk and are not next quarter's revenue.
For Neutron, the questions now concern spending, available cash and commercial missions under the revised timetable. The chart does not currently support presenting RKLB as a strong growth stock with a ready entry. Recovering its 200 day average at USD 81.26 would be an initial requirement of our longer term trend filter.
Planet wins a specific ESA project
On 13 October, Planet announces an ESA project in Slovenia. Through subsidiary Sinergise, a twelve month pilot will help detect changes on the ground and trigger targeted high resolution imagery. Wildfire detection is one intended application.
That describes a tangible use for satellite imagery, but the announcement gives no contract value. A pilot does not yet establish a large recurring business. The useful question is whether it leads to applications that customers keep paying for.
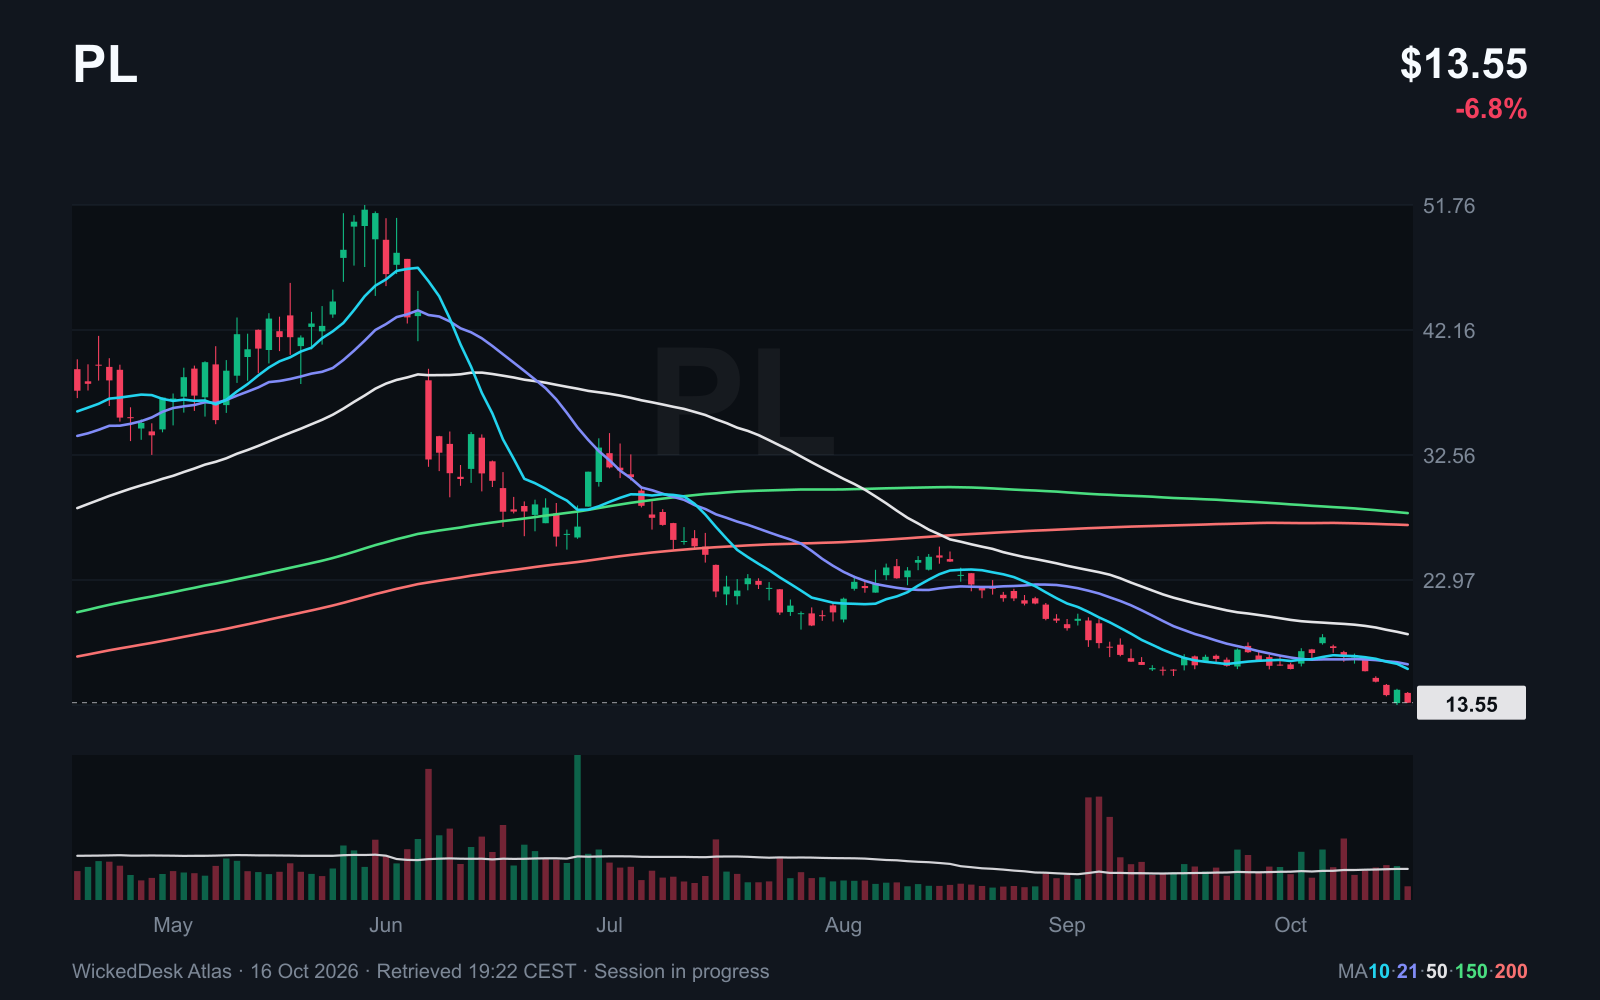
PL loses 21.13% over the week and trades at USD 13.55 on Friday afternoon, well below its 200 day average at USD 27.19. An interesting company announcement and a weak chart can coexist. Planet therefore remains outside our trend criteria.
AST SpaceMobile needs revenue from its coverage
ASTS is developing mobile connectivity from space for ordinary smartphones. Satellite launches are only one part of the economics. Usable coverage, capacity, regulatory approvals and paying customers determine whether the network can support itself.
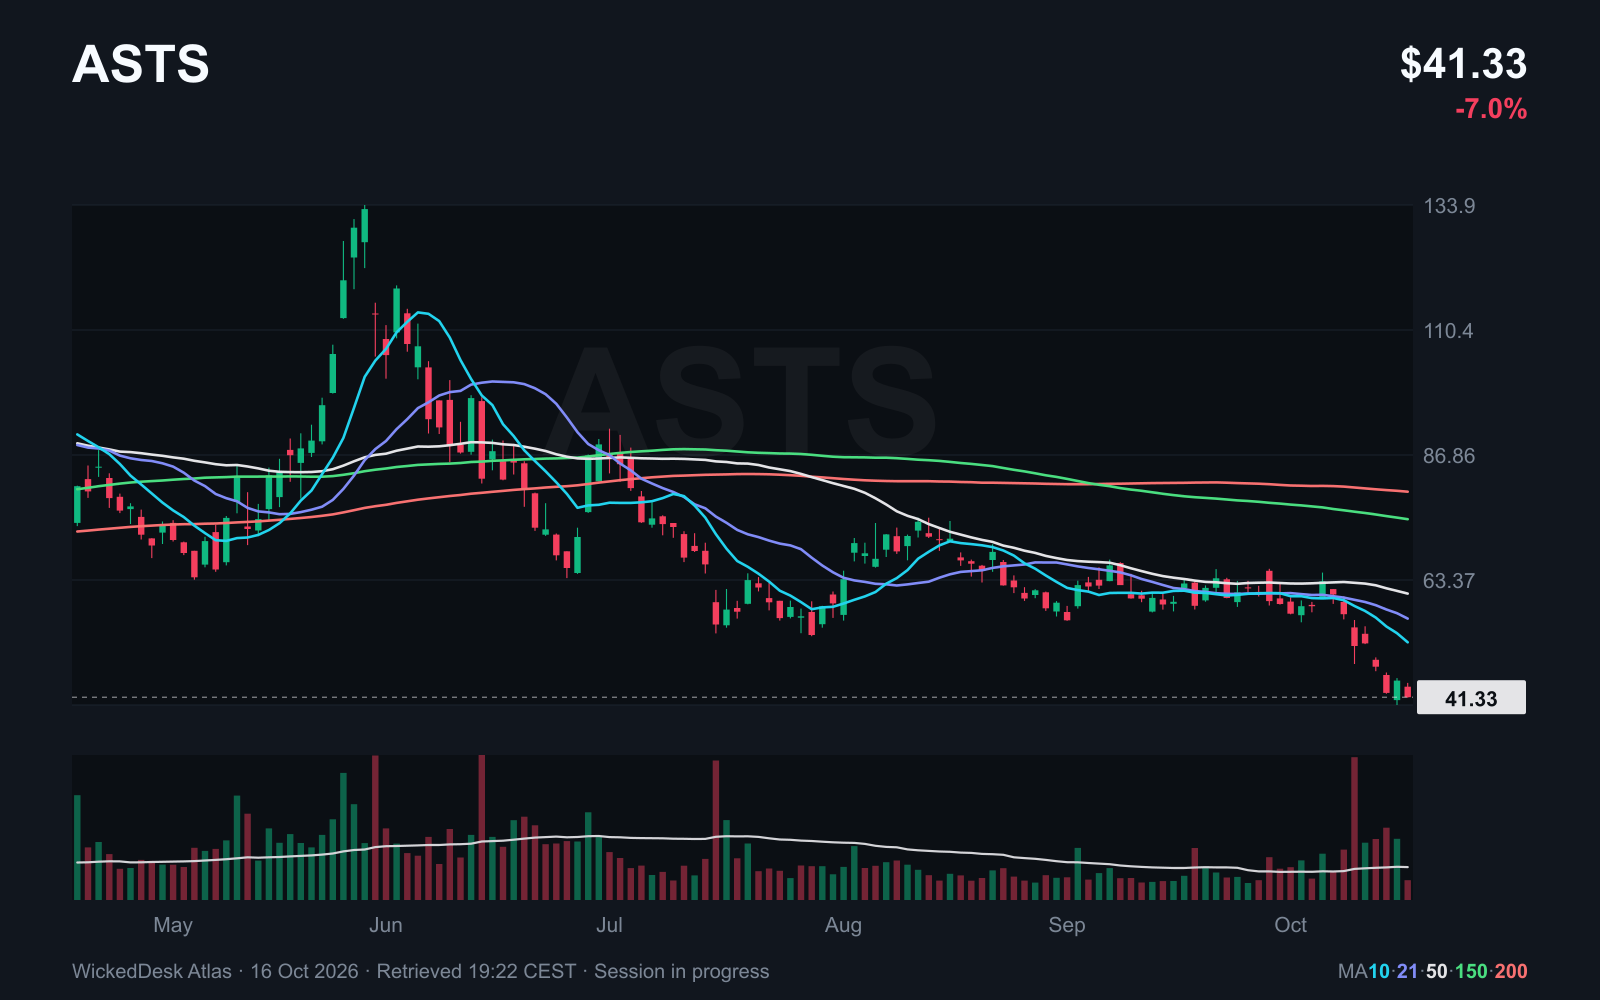
The chart currently offers little support for an optimistic entry thesis. ASTS trades at USD 41.33, down 7.04% on Friday and 18.91% over the week. Its 200 day average is at USD 79.97.
The price decline does not establish who sold or prove that a financing transaction is coming. Fresh information on funding and commercial operations would matter. Until price develops a workable base and a better trend, this remains a company study.
SpaceX represents more than Starlink
SpaceX, traded as SPCX, reports the segments Space, Connectivity and AI. Connectivity generates USD 4.29bn in second quarter revenue and USD 1.66bn in operating profit. That is an operating business rather than only a promise of future satellite revenue.
Capital requirements concern the whole group, however. Of USD 18.37bn in total second quarter capital expenditure, USD 15.83bn relates to AI. Treating SPCX solely as a Starlink stock leaves out a substantial part of its financing needs. These quarterly figures provide business context; they are not new results released this week.
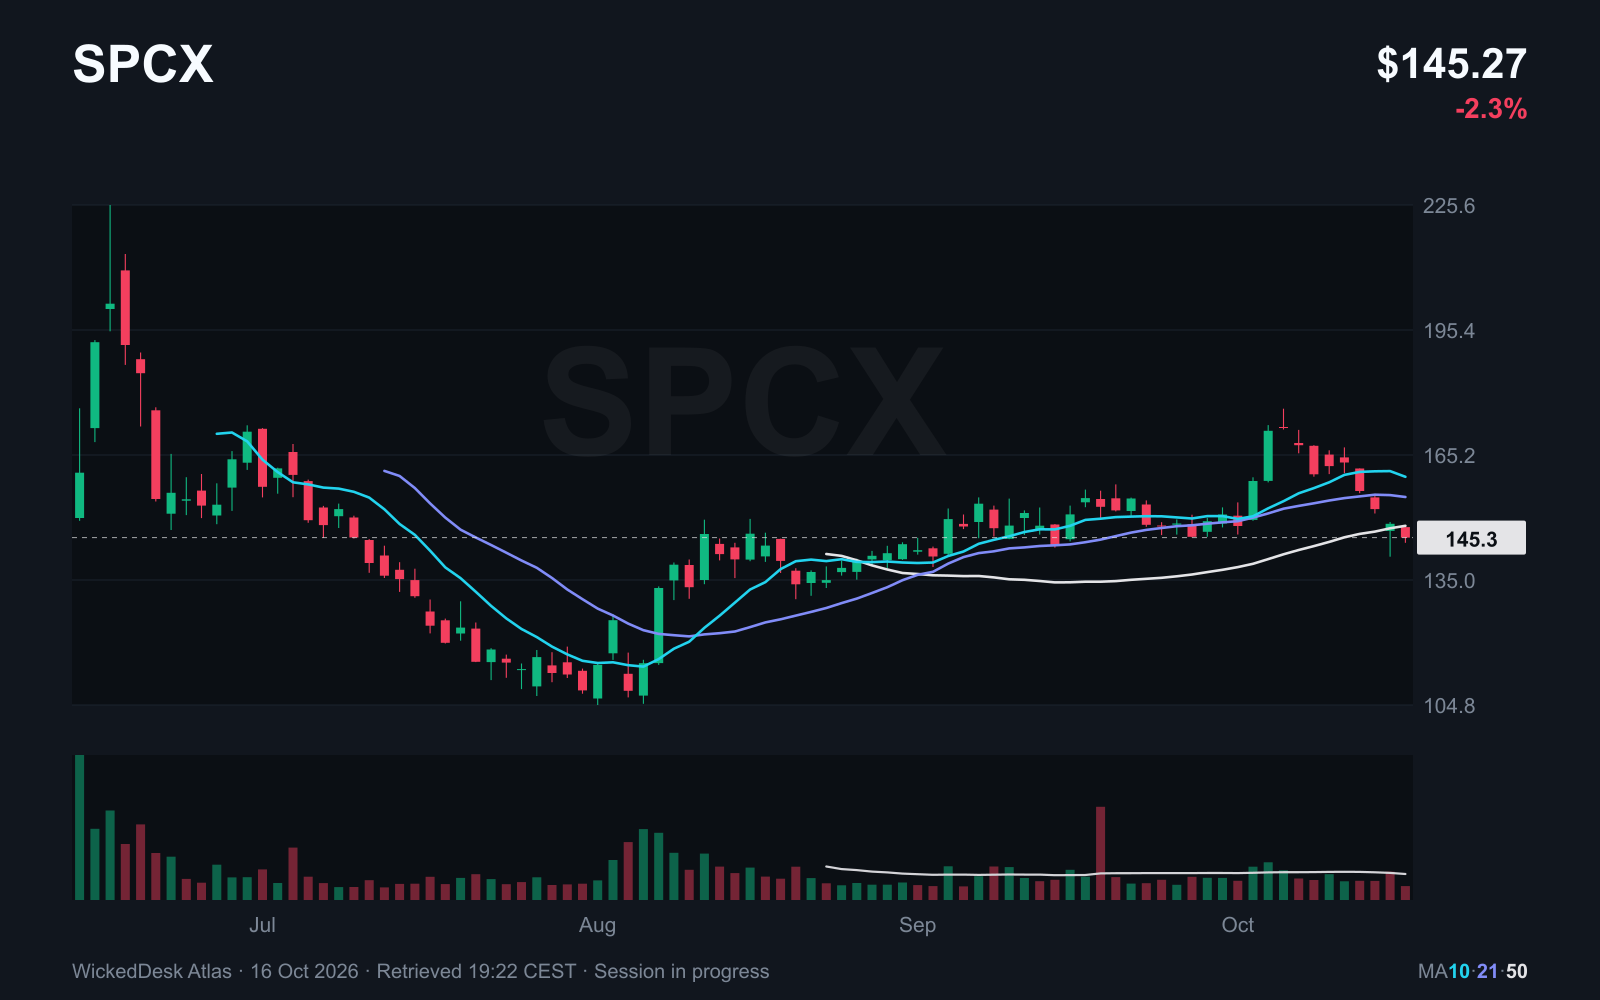
SPCX trades at USD 145.27 on Friday afternoon, down 10.64% over the week. It is now also below its 50 day average of USD 148.13. Fewer than 200 trading sessions have elapsed since its listing, so a 200 day average is not yet available.
Intuitive Machines also delivers communications satellites
LUNR is not solely a bet on lunar missions. On 15 September, Intuitive Machines announced the handover of SXM 11 to SiriusXM after testing in orbit. This is older context showing how additional activities have changed the business.
The stock trades at USD 10.88 on Friday afternoon, down 17.51% over the week. Its 200 day average is USD 20.15. The completed satellite handover does not change the fact that the stock currently fails our longer term trend filter.
Further reports need to show which projects are accepted, when payments arrive and how available cash develops. A growing order backlog alone is insufficient if delivering those orders consumes increasing amounts of cash.
Four space stocks fail the trend filter
RKLB, ASTS, PL and LUNR all trade below their 200 day averages. In our approach, they are not current entry candidates. SPCX does not yet have 200 trading sessions and is treated separately. None of these five stocks becomes a buy recommendation simply because its business is interesting.
Their business differences still matter. An Electron order for 2028, an ESA pilot and monthly mobile service revenue affect cash at different times. Issuing new shares reduces an existing shareholder's ownership percentage unless they buy more. Borrowing avoids that immediate dilution but adds interest costs and repayment obligations.
The next review therefore needs available cash, ongoing cash consumption and contractual payments together. Only then does it make sense to ask whether the chart is developing an entry with a manageable risk.
| Symbol | Price USD | Trend filter | Since 9 October |
|---|---|---|---|
| RKLB | 51.54 | Below SMA 200 | -24.44 % |
| ASTS | 41.33 | Below SMA 200 | -18.91 % |
| PL | 13.55 | Below SMA 200 | -21.13 % |
| LUNR | 10.88 | Below SMA 200 | -17.51 % |
| SPCX | 145.27 | Fewer than 200 sessions, below SMA 50 | -10.64 % |
- Price USD
- 51.54
- Trend filter
- Below SMA 200
- Since 9 October
- -24.44 %
- Price USD
- 41.33
- Trend filter
- Below SMA 200
- Since 9 October
- -18.91 %
- Price USD
- 13.55
- Trend filter
- Below SMA 200
- Since 9 October
- -21.13 %
- Price USD
- 10.88
- Trend filter
- Below SMA 200
- Since 9 October
- -17.51 %
- Price USD
- 145.27
- Trend filter
- Fewer than 200 sessions, below SMA 50
- Since 9 October
- -10.64 %
Bitcoin falls below its 50 day average
Bitcoin trades at 80,972.75 USDT on Binance in Friday's snapshot, down 2.01% from the 9 October UTC daily close. Ethereum trades at 2,401.11 USDT and loses 3.48%. Both Friday sessions are still in progress. USDT is the quote currency of these pairs, not a US stock market closing price in dollars.
Bitcoin is now just below its 50 day average at 81,272 USDT and below its 21 day average at 83,623 USDT. Ethereum is below both as well. The 50 day average that Bitcoin still held on Wednesday has been lost for now. Whether that remains true at the daily close is still open.
Listed crypto stocks are not moving higher together either. COIN loses 2.24% over the week and, at USD 175.38, trades below its 200 day average of USD 182.33. MSTR loses 11.25% and, at USD 136.98, remains only just above its 200 day average at USD 135.61. A higher Bitcoin price would not be sufficient reason to treat every crypto stock the same way.
Gold does not protect every single week
From the 9 October close to Friday's snapshot, the gold ETF GLD loses 0.83%. Silver ETF SLV falls 5.81%. TLT, holding long dated US Treasuries, gains 2.52%. These are changes in fund share prices, not exact reproductions of spot prices or total returns including distributions.
Anyone investing in real assets because of inflation needs to allow for these differences. Gold does not pay interest. Silver also has substantial industrial demand. Bitcoin can be sold alongside riskier investments during periods of stress. None of these three assets guarantees compensation for every increase in living costs.
Rather than assuming that an asset always provides protection, ask which risks already dominate your portfolio. Cash for near term expenses, a long investment horizon and limited individual positions address different problems from finding the next strong stock.
Next week brings a closer look at revenue and margins
Netflix reports after the US close on Tuesday, 20 October. The question is whether profitability keeps pace with revenue growth. Tesla and IBM follow on Wednesday. Tesla has already reported third quarter deliveries of 486,532 vehicles and energy storage deployments of 13.7 gigawatt hours. The results will show how much profit and free cash flow came with them.
IBM offers another view of software demand and corporate spending. For all three companies, guidance and the subsequent price reaction need separate attention. This week has already provided examples of good results followed by stocks giving back their initial gains.
Germany's flash purchasing managers index is due on Friday, 23 October. The survey offers an early indication of October business conditions. Following the rise in energy costs, new orders and companies' pricing responses are particularly relevant.
Two questions remain for our stock studies. Can MRNA find buyers after Friday's sharp pullback? Can MU and MRVL recover the areas they lost? In space companies, we will watch financing disclosures and measurable project progress. An interesting industry is no reason to ignore a damaged chart.
| Event | Date | Check | Time CEST |
|---|---|---|---|
| NFLX earnings | Tue, 20 Oct | Revenue, margin and guidance | After US close, around 22:01 |
| TSLA earnings | Wed, 21 Oct | Delivery profitability and free cash flow | After US close, call at 23:30 |
| IBM earnings | Wed, 21 Oct | Software growth and corporate spending | Call at 23:00 |
| Germany: flash purchasing managers index | Fri, 23 Oct | Orders, business activity and prices | 09:30 |
- NFLX earnings
- Date
- Tue, 20 Oct
- Check
- Revenue, margin and guidance
- Time CEST
- After US close, around 22:01
- TSLA earnings
- Date
- Wed, 21 Oct
- Check
- Delivery profitability and free cash flow
- Time CEST
- After US close, call at 23:30
- IBM earnings
- Date
- Wed, 21 Oct
- Check
- Software growth and corporate spending
- Time CEST
- Call at 23:00
- Germany: flash purchasing managers index
- Date
- Fri, 23 Oct
- Check
- Orders, business activity and prices
- Time CEST
- 09:30