
More revenue. Less money left over.
Last week we looked at rising prices. This week I want to look at where companies spend their money. Meta is growing quickly, but investment in equipment and infrastructure has grown even faster. Tesla follows its Roadster presentation with a report on the business it actually operates today. Both stories raise the same question: how much will that promised future cost?
The biggest growth figure in a press release is not enough. I want to see cash coming in, cash going out and how the stock responds. Our previous stock studies also stay in the issue. Moderna’s sharp decline belongs here just as much as the better performance at Okta and CareDx.
Prices were captured on Thursday, 22 October, between 20:32 and 20:33 CEST during the US session. They are not closing prices. Weekly comparisons start at the 16 October close. Economic figures carry their own observation dates. The following Friday chapters add news and a new price snapshot from 23 October.
European growth slows while inflation expectations remain elevated
The flash composite purchasing managers’ index for the eurozone falls to 51.9 in October from 53.1. Reuters reports today’s S&P Global figures alongside rising energy related costs. Above 50, surveyed activity is still expanding, but at a slower pace. (Source: Reuters / Eurozone PMI).
The University of Michigan’s final US consumer sentiment reading is 48.0, compared with 48.1 in September. Year ahead inflation expectations rise to 4.7%, while long run expectations reach 3.5%. These are respondents’ expectations, not measured inflation rates. (Source: University of Michigan).
This complicates the central banks’ decisions. Higher rates can curb borrowing, demand and new investment. They do not repair a refinery or add energy supply. Tolerating rising costs can also entrench expectations of persistently faster price increases. Next week’s explanation of each decision will therefore matter alongside the rate itself.
American Express raises guidance; SLB revenue rises but reported EPS falls
American Express reports $20.06 billion in revenue net of interest expense, up 9% year on year. Reported EPS is $5.42, compared with adjusted EPS of $4.68. The company raises its adjusted annual EPS outlook to $17.60 to $17.90. A gain on a stake sale explains part of the gap between the quarterly measures. (Source: American Express / Form 8-K).
SLB reports $9.45 billion in quarterly revenue, up 6% year on year. Reported EPS falls from $0.50 to $0.49; adjusted EPS is $0.64. Higher revenue does not automatically produce higher reported earnings. Actual project awards and their profitability matter for the energy business. (Source: SLB / Business Wire).
American Express offers a view of its customers’ spending; SLB offers a view of its clients’ investment. Neither represents the whole economy, but both provide concrete business evidence for the discussion of demand and capital spending.
Thursday’s selling hits the Nasdaq hardest
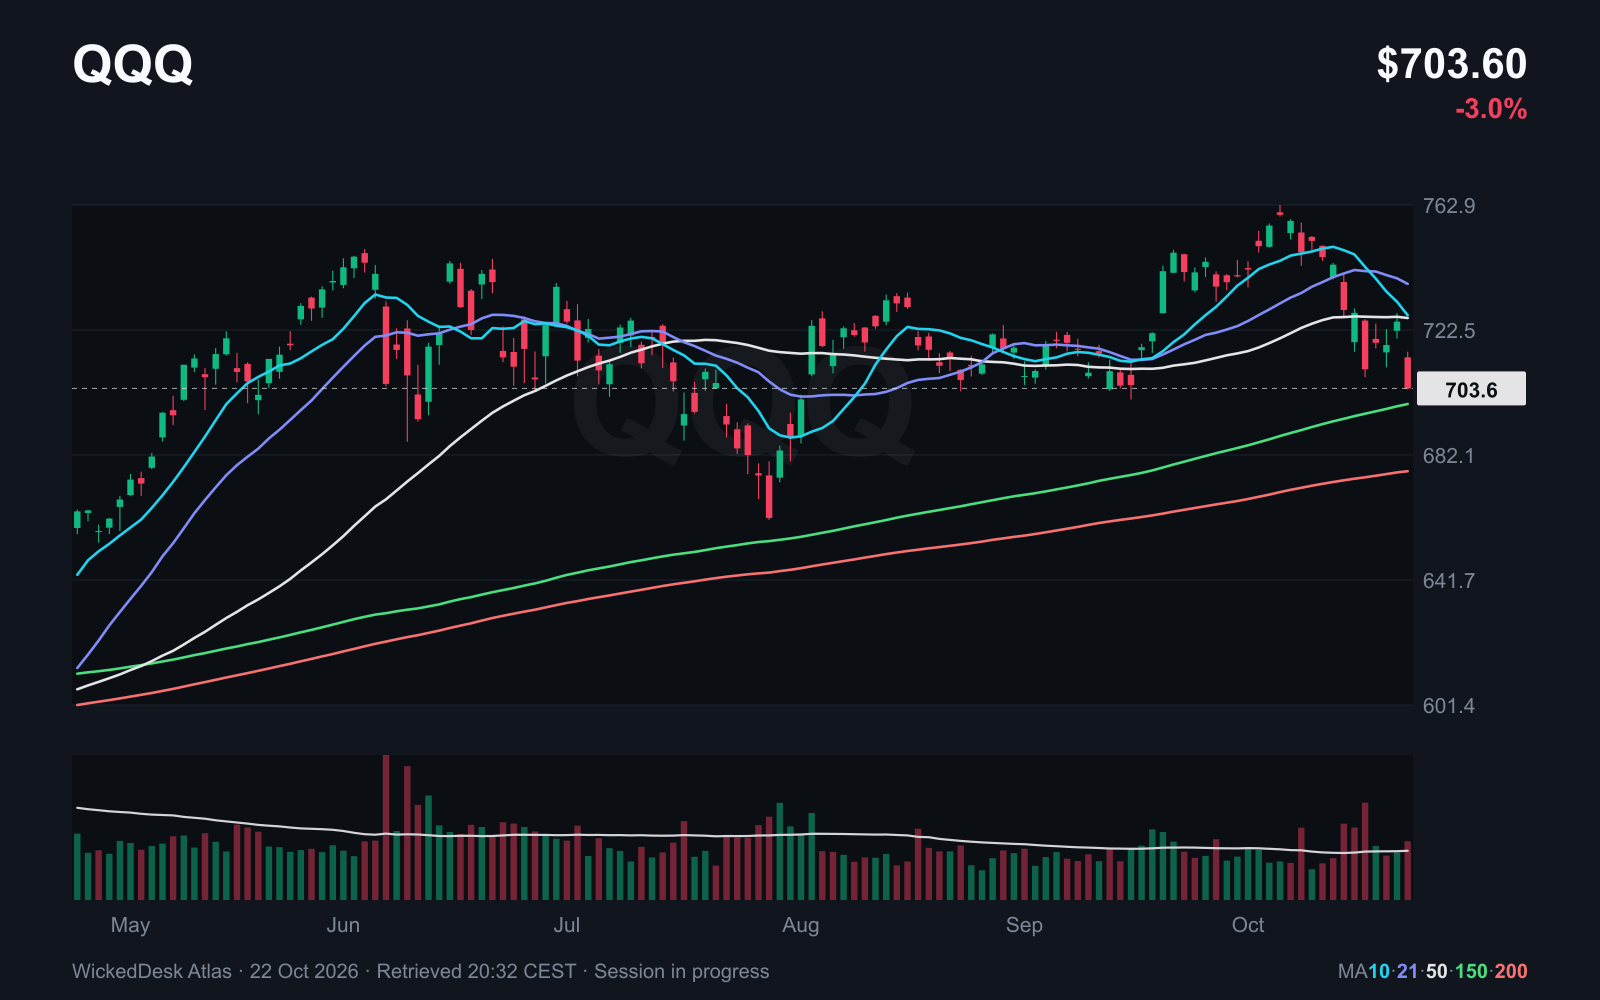
QQQ, the Nasdaq 100 ETF, is down 2.98% from Wednesday’s close in our snapshot. Since last Friday, however, the loss is 0.87%. Both numbers matter: Thursday’s selling gives back part of the preceding recovery.
SPY falls 1.45% on the day, while DIA, the Dow ETF, loses just 0.23%. Smaller companies represented by IWM are still up 1.98% since Friday. Yet IWM remains below its 200 day average. A better week does not by itself repair a weak longer term trend.
The table shows ETF prices in dollars and price changes excluding distributions, not index levels.
| Symbol | SMA 200 | Price USD | On Thursday | Since 16 Oct |
|---|---|---|---|---|
| SPY | 726.64 | 761.87 | -1.45 % | -0.18 % |
| QQQ | 676.89 | 703.60 | -2.98 % | -0.87 % |
| DIA | 505.07 | 526.50 | -0.23 % | +1.43 % |
| IWM | 278.13 | 275.79 | -0.25 % | +1.98 % |
- SMA 200
- 726.64
- Price USD
- 761.87
- On Thursday
- -1.45 %
- Since 16 Oct
- -0.18 %
- SMA 200
- 676.89
- Price USD
- 703.60
- On Thursday
- -2.98 %
- Since 16 Oct
- -0.87 %
- SMA 200
- 505.07
- Price USD
- 526.50
- On Thursday
- -0.23 %
- Since 16 Oct
- +1.43 %
- SMA 200
- 278.13
- Price USD
- 275.79
- On Thursday
- -0.25 %
- Since 16 Oct
- +1.98 %
Health care and everyday products attract buyers
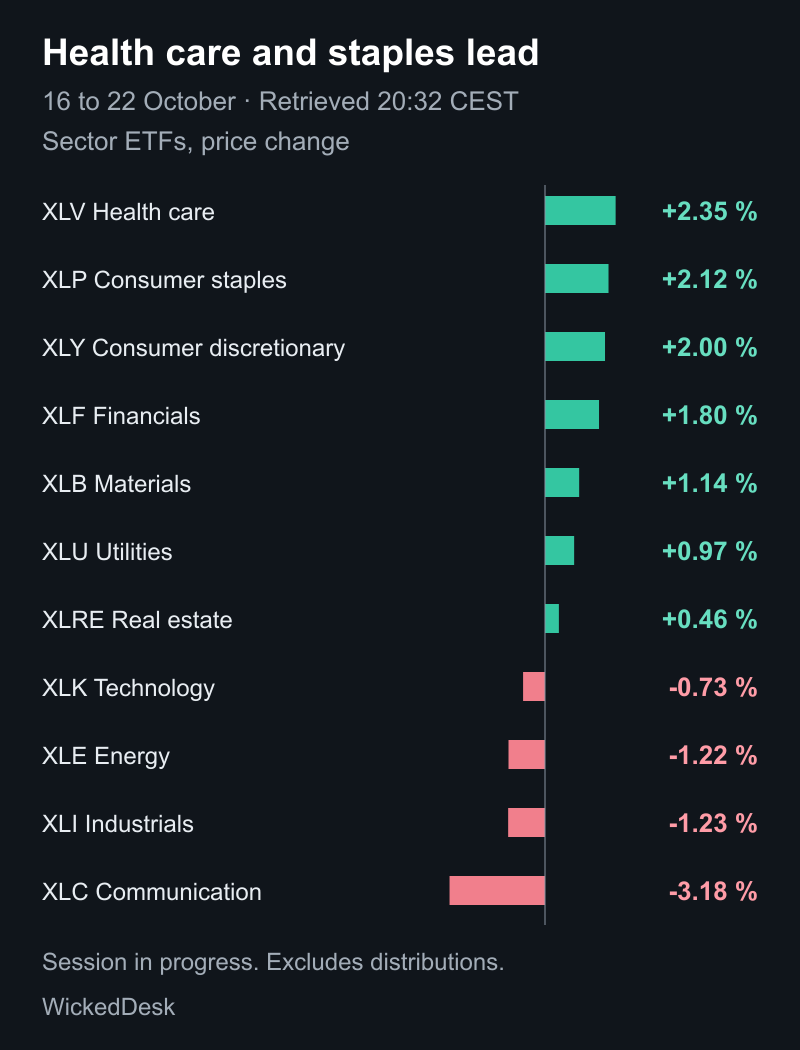
Health care ETF XLV is up 2.35% since Friday, with consumer staples ETF XLP gaining 2.12%. Communication services ETF XLC loses 3.18%. Technology ETF XLK is down 0.73% for the period after falling 3.40% on Thursday alone.
That does not mean every health care stock is rising. Moderna provides a clear counterexample. These sector ETFs are weighted by company size. They help us see the direction of travel, but do not replace individual stock analysis. The graphic uses the same comparison dates for all eleven sectors.
Energy is down 1.22% this time. Its strength in issue 018 has not continued unchanged. Reading only the headlines about expensive oil could easily hide that difference.
Meta’s cash generation no longer covers all its investment spending
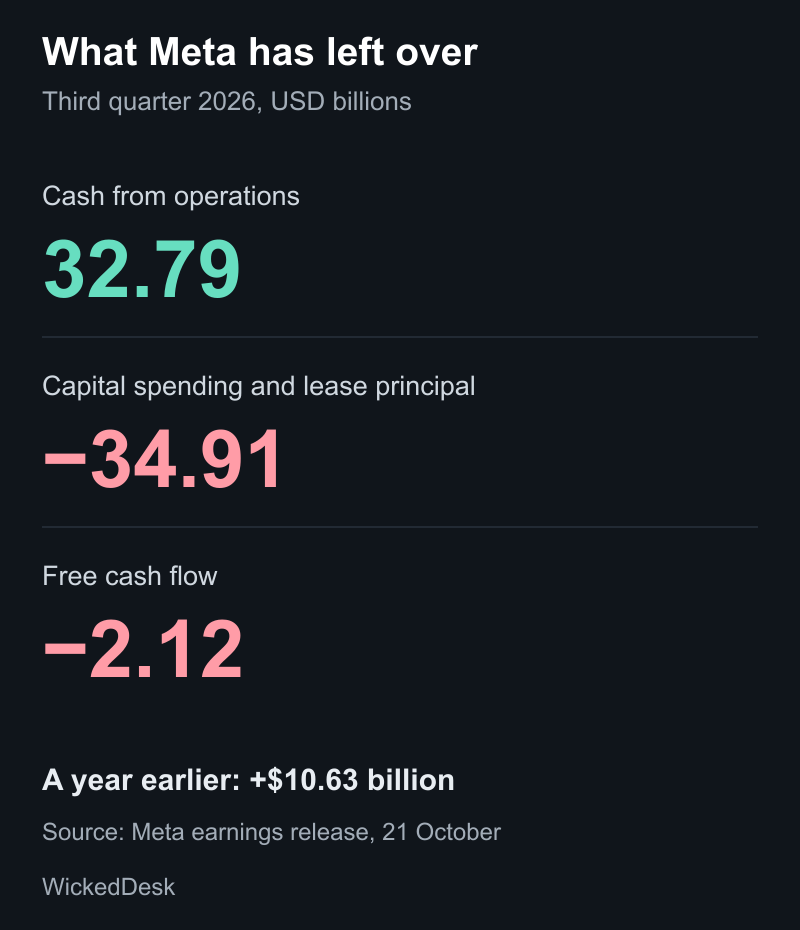
Meta reports quarterly revenue of $64.60 billion, up 26% from a year earlier. Operations generate $32.79 billion in cash. Capital expenditure, including finance lease principal payments, reaches $34.91 billion. Free cash flow is therefore negative $2.12 billion, versus positive $10.63 billion a year earlier. (Source: Meta earnings release).
Free cash flow is the money left after those investments. One negative quarter does not automatically mean a company is in trouble. What matters is whether the additional assets eventually earn enough. For shareholders, the question is how long spending grows faster than the cash it produces.
A separate $9.89 billion legal accrual also weighs on earnings. It should not be presented as a data centre construction cost. The income statement and the cash flow statement tell different parts of the story.
Meta falls back towards its longer term trend
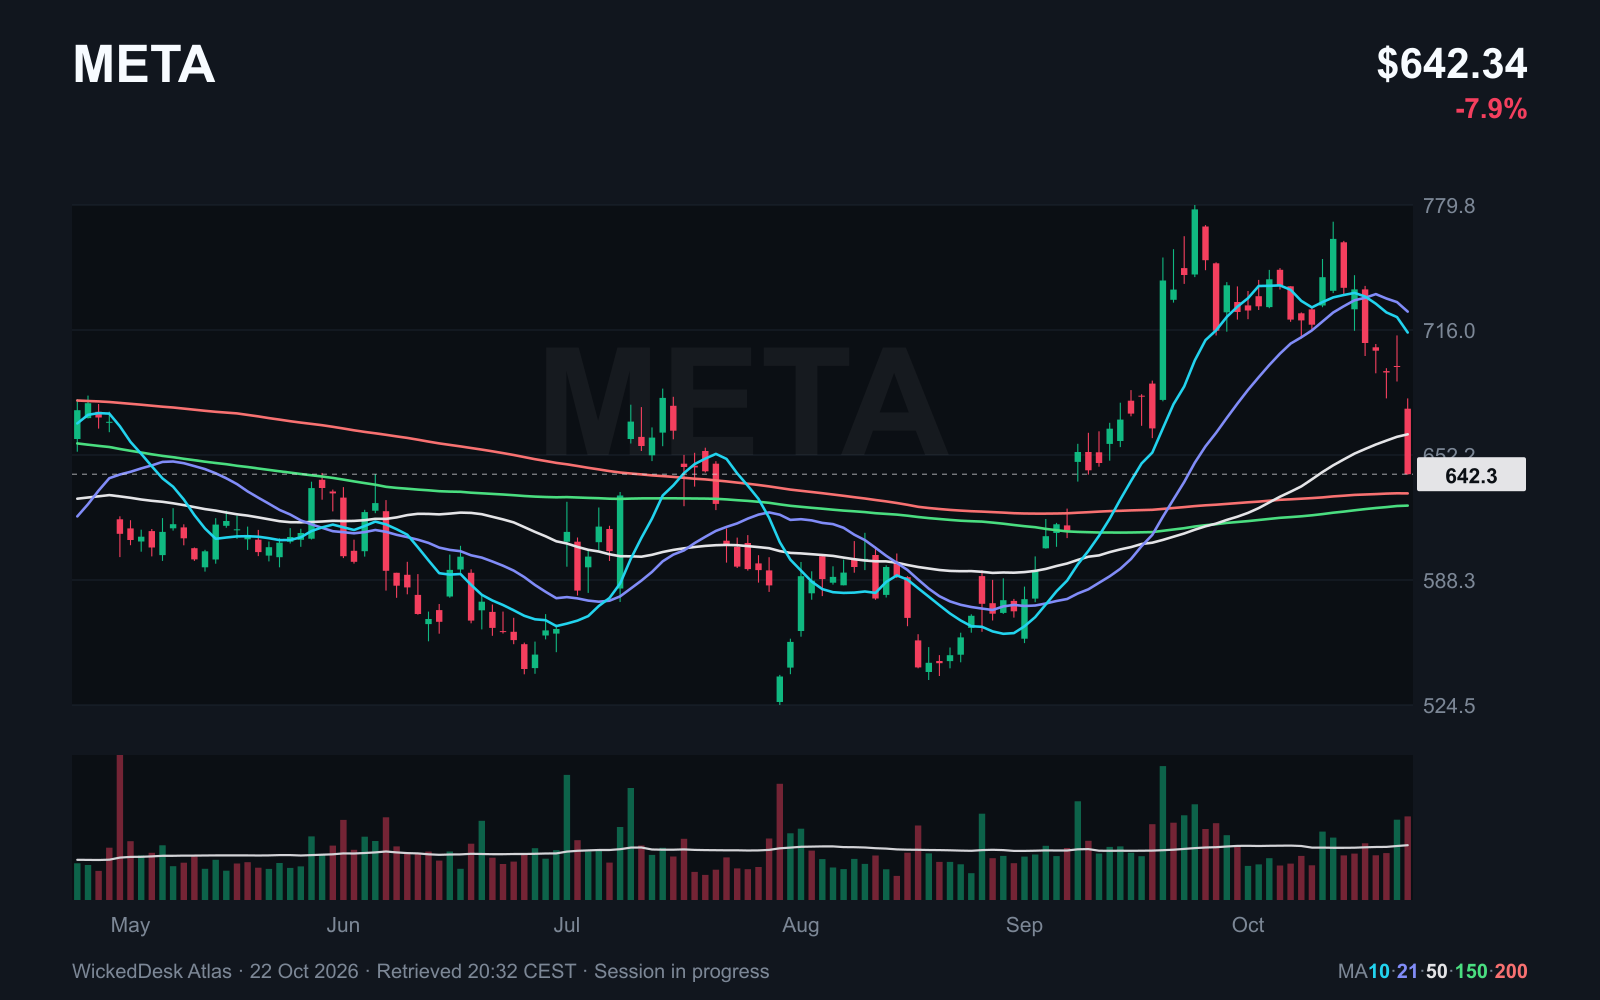
META trades at $642.34, down 7.91% from Wednesday’s close. It has fallen below its 50 day average at $662.73. The 200 day average at $632.53 is now only a short distance away.
The chart shows selling after the report, but it cannot tell us which sentence caused which part of the decline. Investment plans, legal costs and growth expectations all matter. Timing alone does not provide a precise breakdown of the price reaction.
For a fresh study, I want to see whether the stock can build a more stable trading range above that longer term average. While selling pressure continues, a lower price alone does not make it more attractive.
After the Roadster, Tesla reports on the business
Tesla generates $28.05 billion in third quarter revenue, roughly unchanged from a year earlier. Operating profit falls 56% to $718 million. GAAP earnings per share are $0.22, compared with adjusted earnings of $0.48. Free cash flow remains positive at $1.53 billion. (Source: Tesla financial summary).
The Roadster presentation was last week’s story. This report lets us examine what the existing business earns. A new model can be interesting while current profitability deteriorates. Confusing the two risks paying today for profits that still have to materialise.
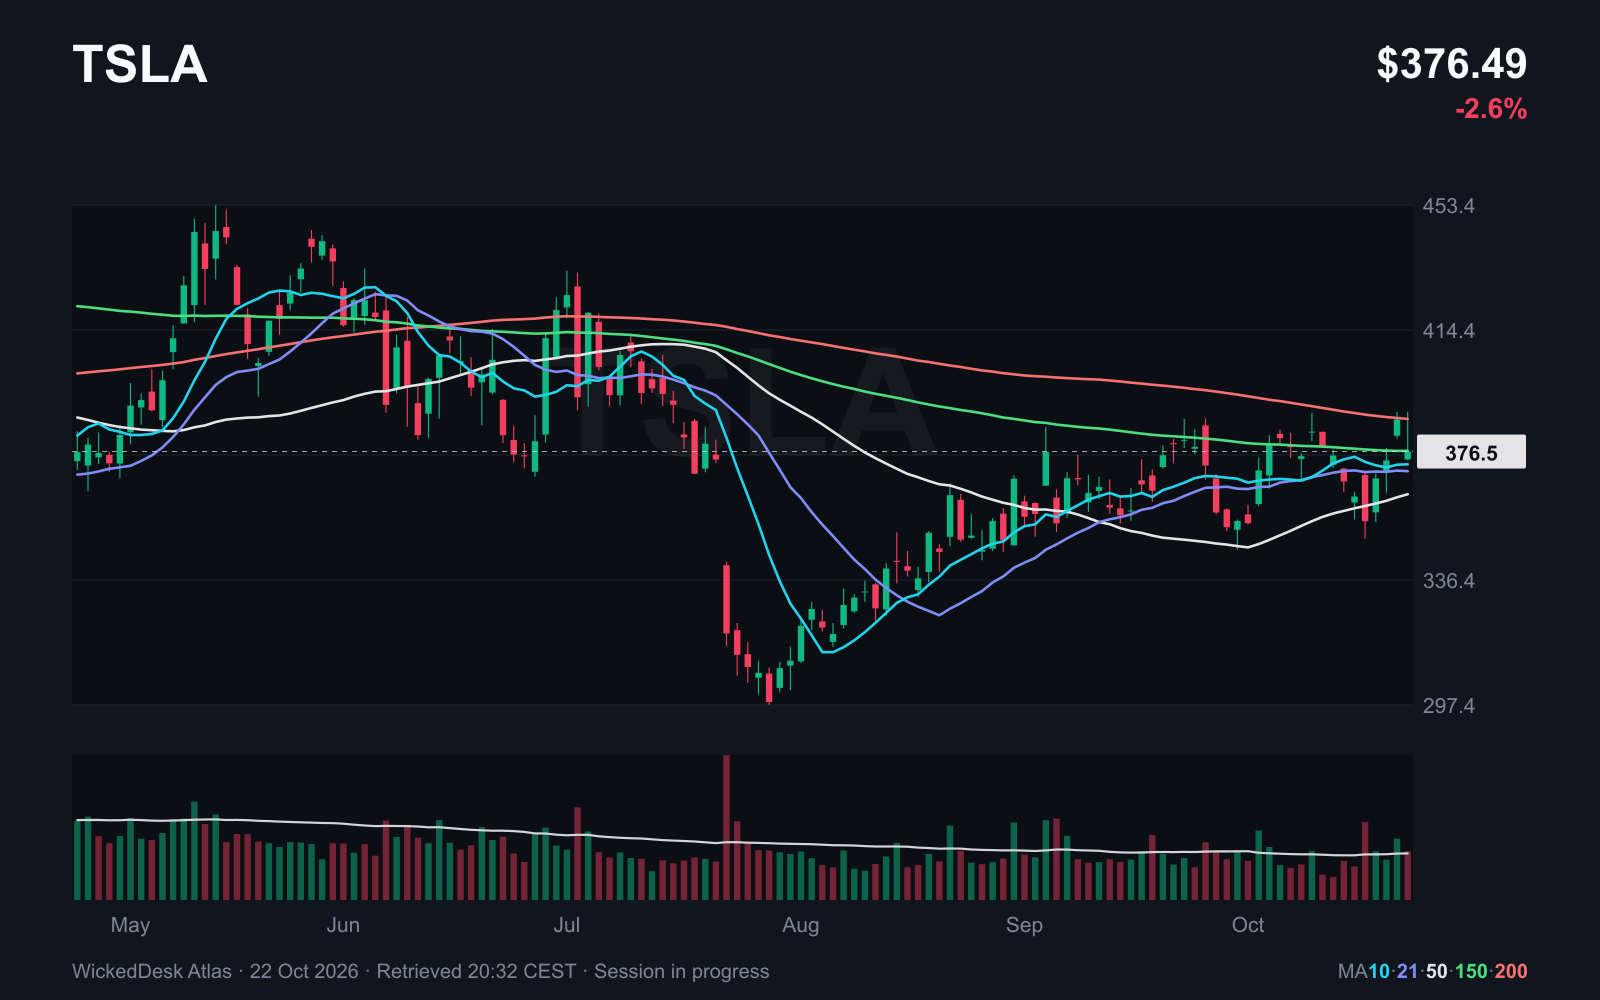
TSLA is up 6.14% since Friday. On Thursday it falls 2.58%, however, and at $376.49 remains below its 200 day average of $386.65. That keeps it outside our narrower search for strong upward trends.
SpaceX’s largest business is no longer rocket launches
SpaceX reports $14.58 billion in quarterly revenue: $7.56 billion from Super Intelligence, $5.25 billion from Connectivity and $1.77 billion from Space. Total capital expenditure reaches $19.59 billion, including $16.44 billion in Super Intelligence. (Source: SpaceX report filed with the SEC).
This extends the question from our previous issue. Analysing SPCX now means valuing several very different businesses inside one company. Recurring connectivity revenue, launch services and computing infrastructure carry different costs and risks. A successful launch cannot answer the question of returns on the entire investment programme.
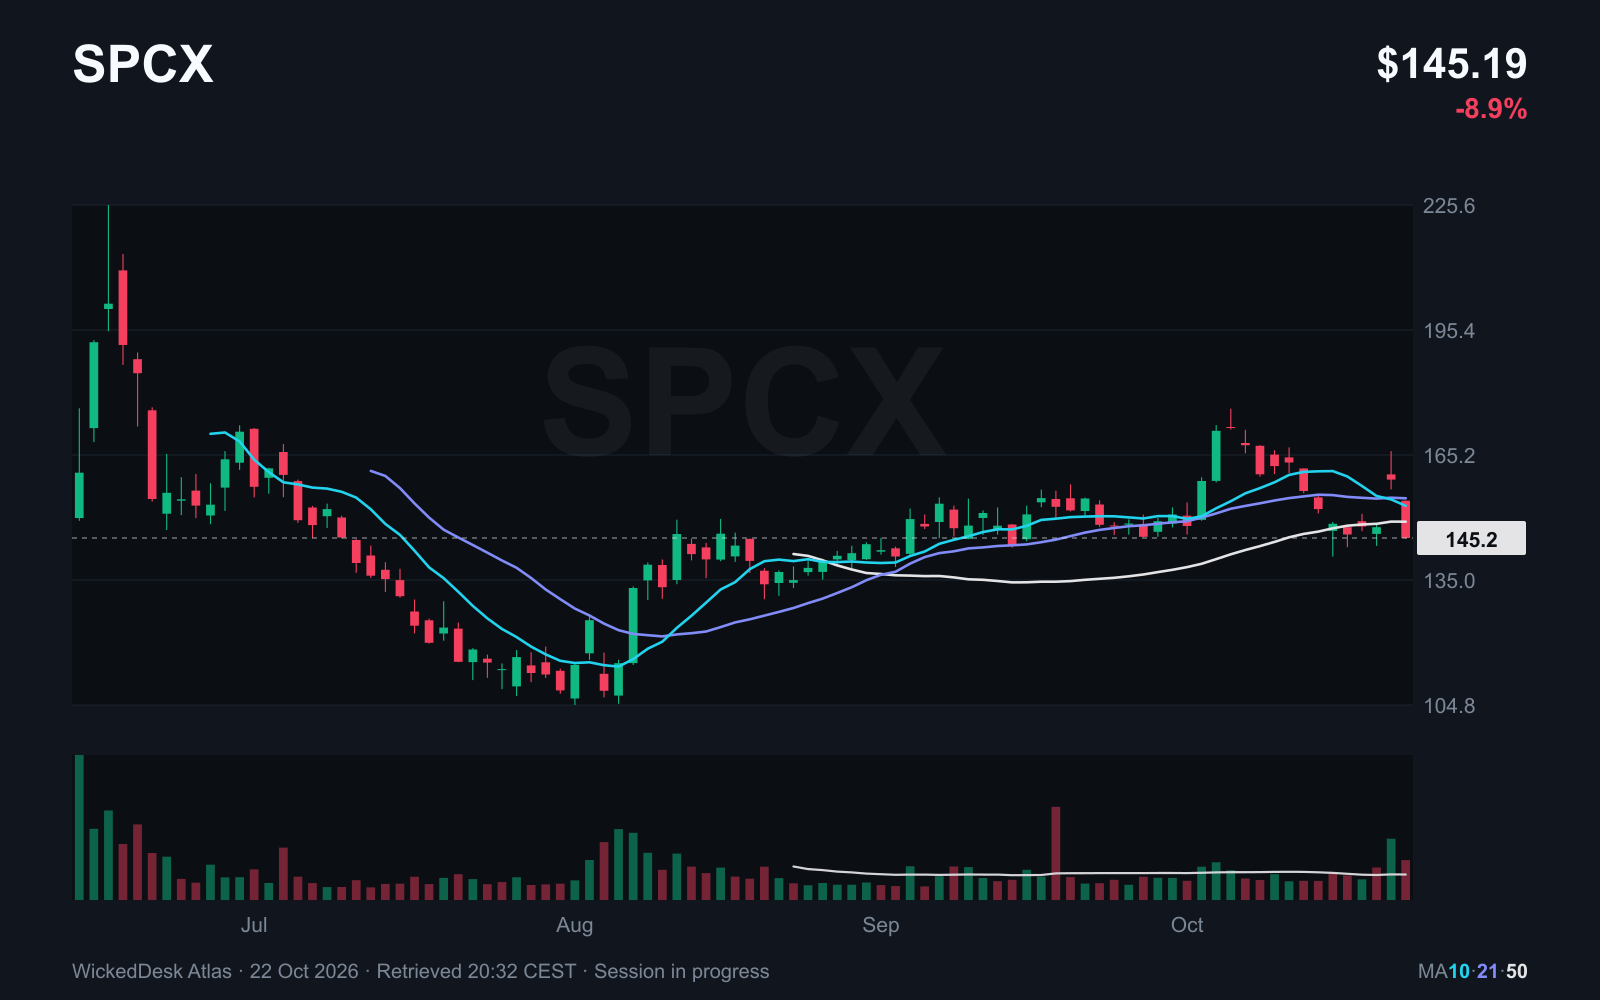
The stock falls 8.86% on Thursday to $145.19 and trades below its 50 day average. There are not yet enough trading sessions for a 200 day average. I will not substitute a shorter line and pretend it means the same thing.
The other space stocks remain weak
RKLB, ASTS, PL and LUNR remain below their respective 200 day averages. Since last Friday ASTS has lost 6.16%, LUNR 5.31% and PL 4.42%. RKLB is down 0.77%.
The businesses remain interesting subjects for research. That does not automatically make this a good entry point. For young infrastructure companies, funding needs must fit available cash and realistically achievable revenue. If capital requirements grow faster, additional shares or borrowing may be necessary.
We keep following these names rather than removing them after a bad week. Trading below the 200 day average excludes new long candidates under our trend following approach. It does not settle the question of the projects’ long term usefulness.
| Symbol | SMA 200 | Price USD | On Thursday | Since 16 Oct |
|---|---|---|---|---|
| SPCX | Not yet available | 145.19 | -8.86 % | -0.58 % |
| RKLB | 80.74 | 50.45 | -6.00 % | -0.77 % |
| ASTS | 79.06 | 38.16 | -6.71 % | -6.16 % |
| PL | 27.04 | 12.96 | -5.47 % | -4.42 % |
| LUNR | 20.00 | 10.21 | -6.43 % | -5.31 % |
- SMA 200
- Not yet available
- Price USD
- 145.19
- On Thursday
- -8.86 %
- Since 16 Oct
- -0.58 %
- SMA 200
- 80.74
- Price USD
- 50.45
- On Thursday
- -6.00 %
- Since 16 Oct
- -0.77 %
- SMA 200
- 79.06
- Price USD
- 38.16
- On Thursday
- -6.71 %
- Since 16 Oct
- -6.16 %
- SMA 200
- 27.04
- Price USD
- 12.96
- On Thursday
- -5.47 %
- Since 16 Oct
- -4.42 %
- SMA 200
- 20.00
- Price USD
- 10.21
- On Thursday
- -6.43 %
- Since 16 Oct
- -5.31 %
Netflix grows, while P&G sells more products
Netflix reports $12.87 billion in revenue, up 11.8% from a year earlier. Its operating margin reaches 34.6%. The company notes that expense timing helped. Full year guidance calls for $51.1 billion in revenue and a 31.5% operating margin. (Source: Netflix shareholder letter).
Procter & Gamble increases quarterly revenue by 4% to $23.28 billion. Sales volume rises 2.4%, while pricing contributes just 0.4%. Reported earnings per share are $1.97, versus adjusted earnings of $2.00. (Source: P&G earnings release).
There is a useful distinction here. P&G’s growth is not simply the result of higher prices. At Netflix, an unusually strong quarterly margin should not be extrapolated unchanged. The stocks also behave differently. NFLX recovers on Thursday but remains 4.81% below last Friday’s close.
P&G shows the other side of Thursday’s market
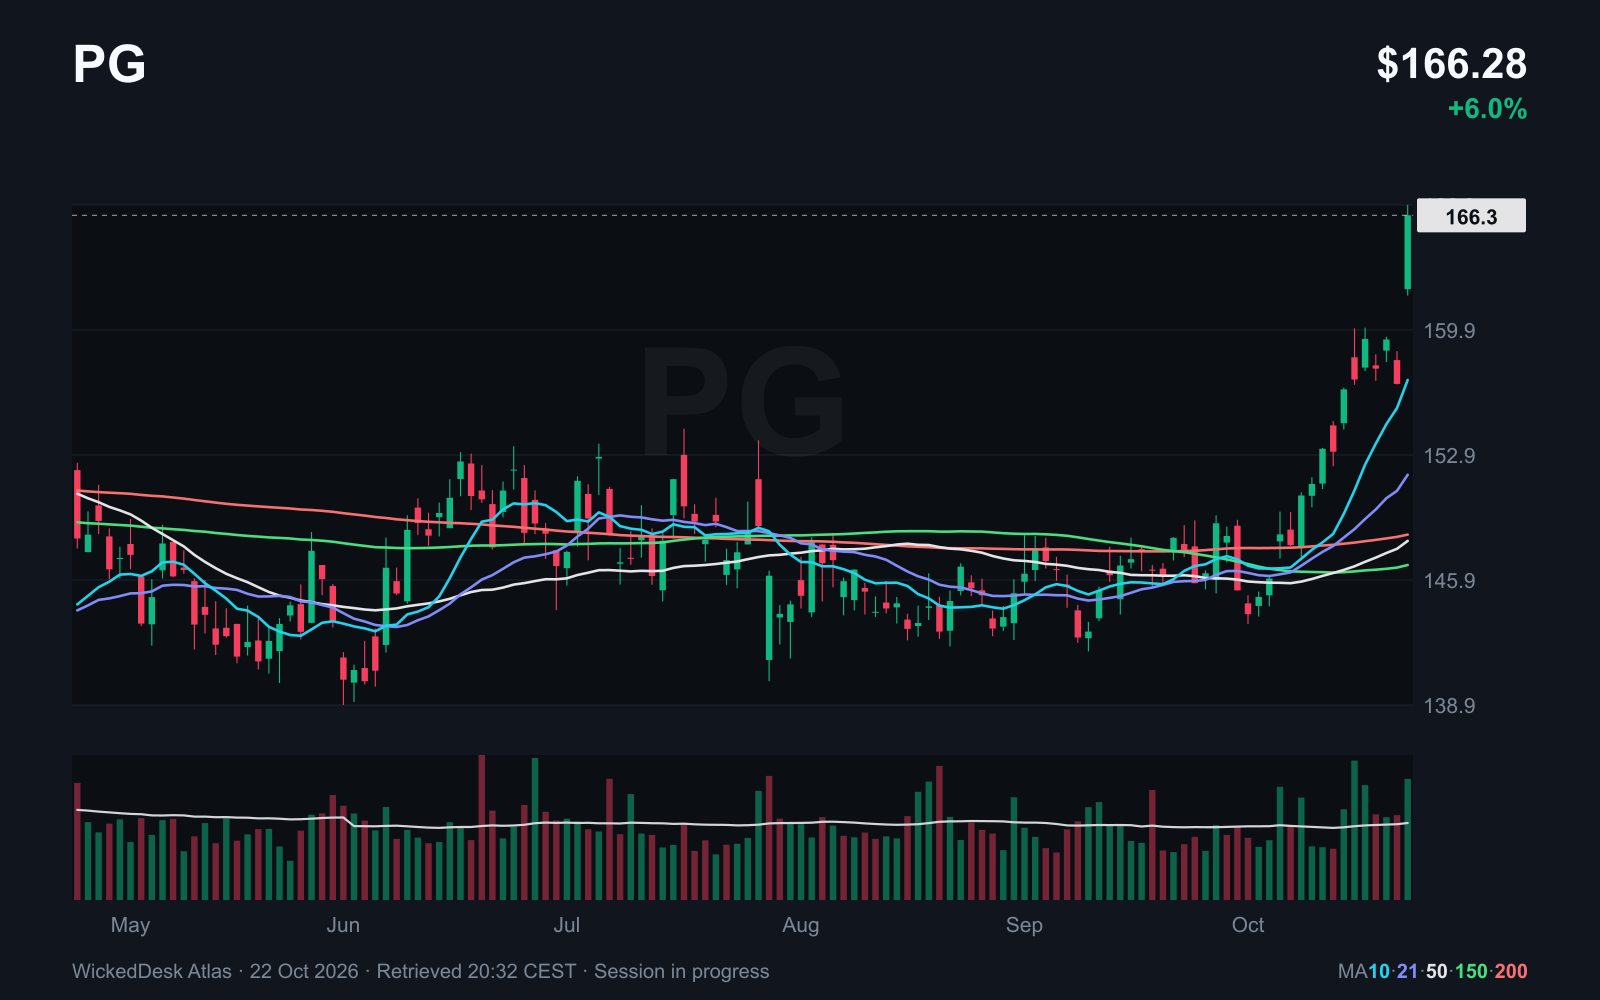
PG rises 6.02% in Thursday’s snapshot to $166.28. It trades well above its 200 day average at $148.40. As several large technology stocks are sold, this everyday products business finds buyers.
A large green daily candle is still not a complete setup. The price has quickly moved away from its averages. What matters next is whether it can retain part of the earnings move and subsequently trade in a narrower range. An immediate retreat into the range before the report would argue against that idea.
The session’s volume is still incomplete. I am not comparing it with full trading days to claim a supposed record.
All nine previous studies stay in the comparison
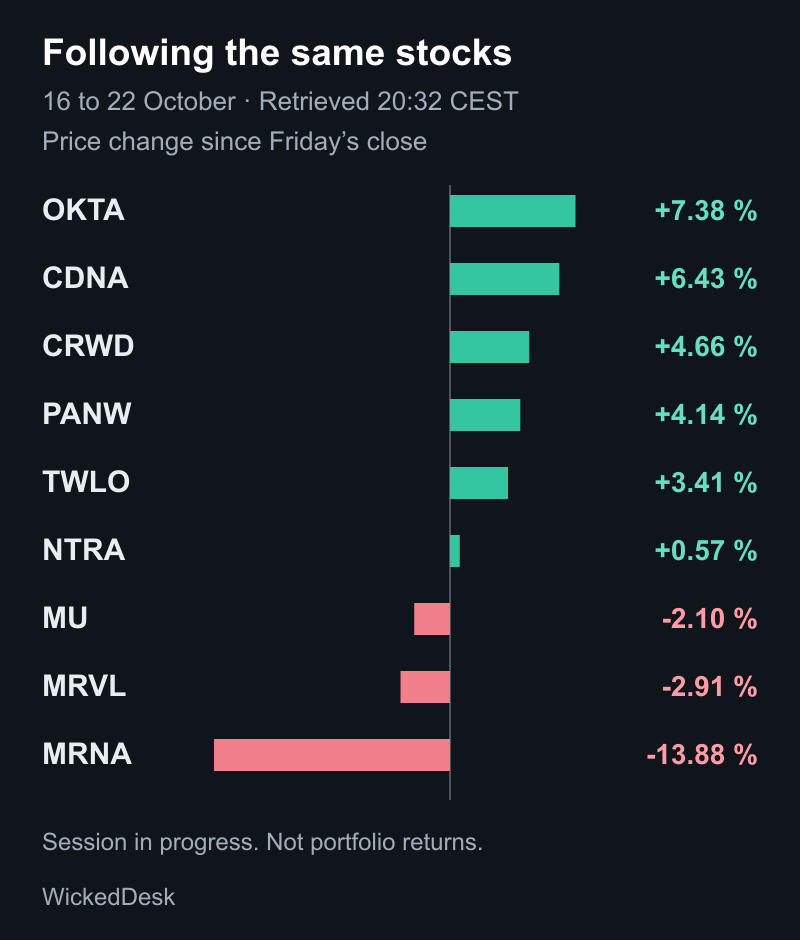
Okta gains 7.38% since Friday, CareDx 6.43% and CrowdStrike 4.66%. Moderna loses 13.88%. Micron and Marvell are also lower.
This is stock performance, not a portfolio return. We followed these names as studies; that does not mean we bought every one of them. The common starting point is the completed 16 October close. It avoids mixing an older intraday snapshot with closing prices.
The next three charts show why a positive weekly comparison is not enough. In each case, the question is how much of the recovery survives a weak trading day.
| Symbol | SMA 200 | Price USD | On Thursday | Since 16 Oct |
|---|---|---|---|---|
| MRNA | 81.27 | 187.75 | -23.62 % | -13.88 % |
| MU | 729.43 | 860.36 | -5.83 % | -2.10 % |
| MRVL | 178.81 | 221.20 | -9.63 % | -2.91 % |
| CRWD | 162.93 | 237.99 | -0.56 % | +4.66 % |
| OKTA | 120.75 | 201.09 | -3.62 % | +7.38 % |
| PANW | 263.97 | 356.15 | +2.56 % | +4.14 % |
| TWLO | 185.34 | 252.71 | -5.24 % | +3.41 % |
| CDNA | 32.01 | 68.12 | -3.71 % | +6.43 % |
| NTRA | 260.85 | 395.70 | -4.28 % | +0.57 % |
- SMA 200
- 81.27
- Price USD
- 187.75
- On Thursday
- -23.62 %
- Since 16 Oct
- -13.88 %
- SMA 200
- 729.43
- Price USD
- 860.36
- On Thursday
- -5.83 %
- Since 16 Oct
- -2.10 %
- SMA 200
- 178.81
- Price USD
- 221.20
- On Thursday
- -9.63 %
- Since 16 Oct
- -2.91 %
- SMA 200
- 162.93
- Price USD
- 237.99
- On Thursday
- -0.56 %
- Since 16 Oct
- +4.66 %
- SMA 200
- 120.75
- Price USD
- 201.09
- On Thursday
- -3.62 %
- Since 16 Oct
- +7.38 %
- SMA 200
- 263.97
- Price USD
- 356.15
- On Thursday
- +2.56 %
- Since 16 Oct
- +4.14 %
- SMA 200
- 185.34
- Price USD
- 252.71
- On Thursday
- -5.24 %
- Since 16 Oct
- +3.41 %
- SMA 200
- 32.01
- Price USD
- 68.12
- On Thursday
- -3.71 %
- Since 16 Oct
- +6.43 %
- SMA 200
- 260.85
- Price USD
- 395.70
- On Thursday
- -4.28 %
- Since 16 Oct
- +0.57 %
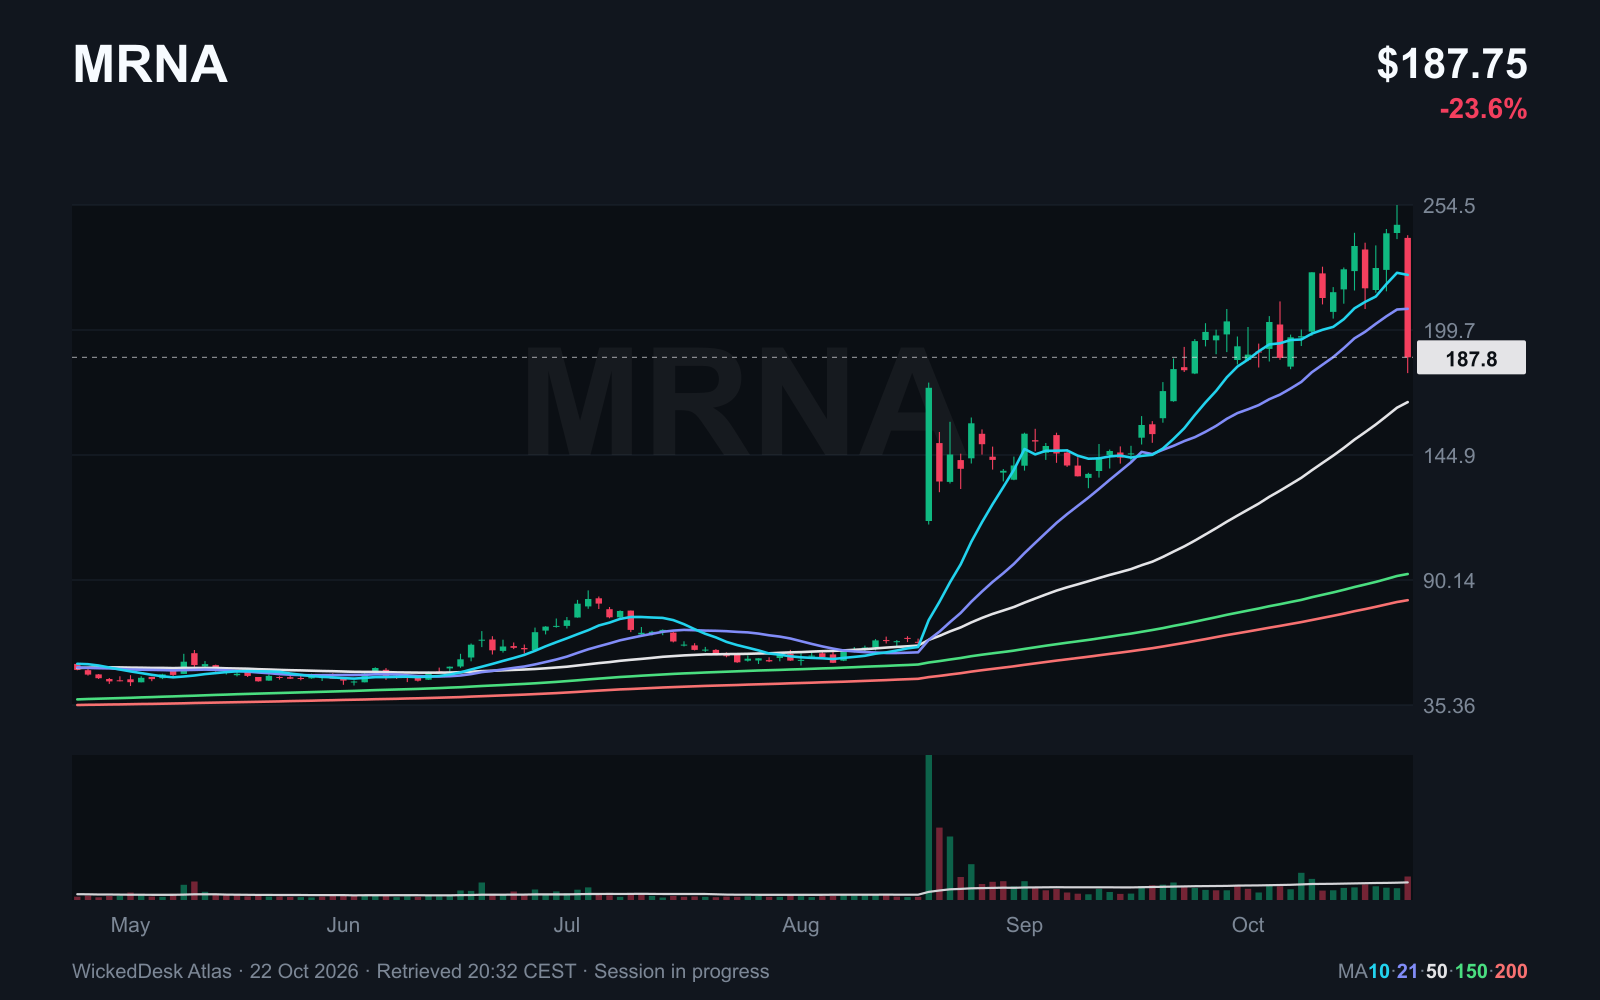
Moderna is no longer a tight consolidation
MRNA falls 23.62% on Thursday to $187.75. It is below its 21 day average at $208.97, although still above the 50 day average at $168.12. The 200 day average remains far below. That does not make the selloff harmless.
A consolidation that might produce a manageable entry is different from this heavy selling. The earlier observation needs to change. First, the stock needs to establish a new trading range. An old high is not evidence that the price will return there.
Moderna announced presentations at the ESMO Congress from 23 to 27 October. Reading the original data matters more than circulating extracts. Price action alone cannot establish the outcome of a clinical study. (Source: Moderna announcement).
CareDx holds up better than the market
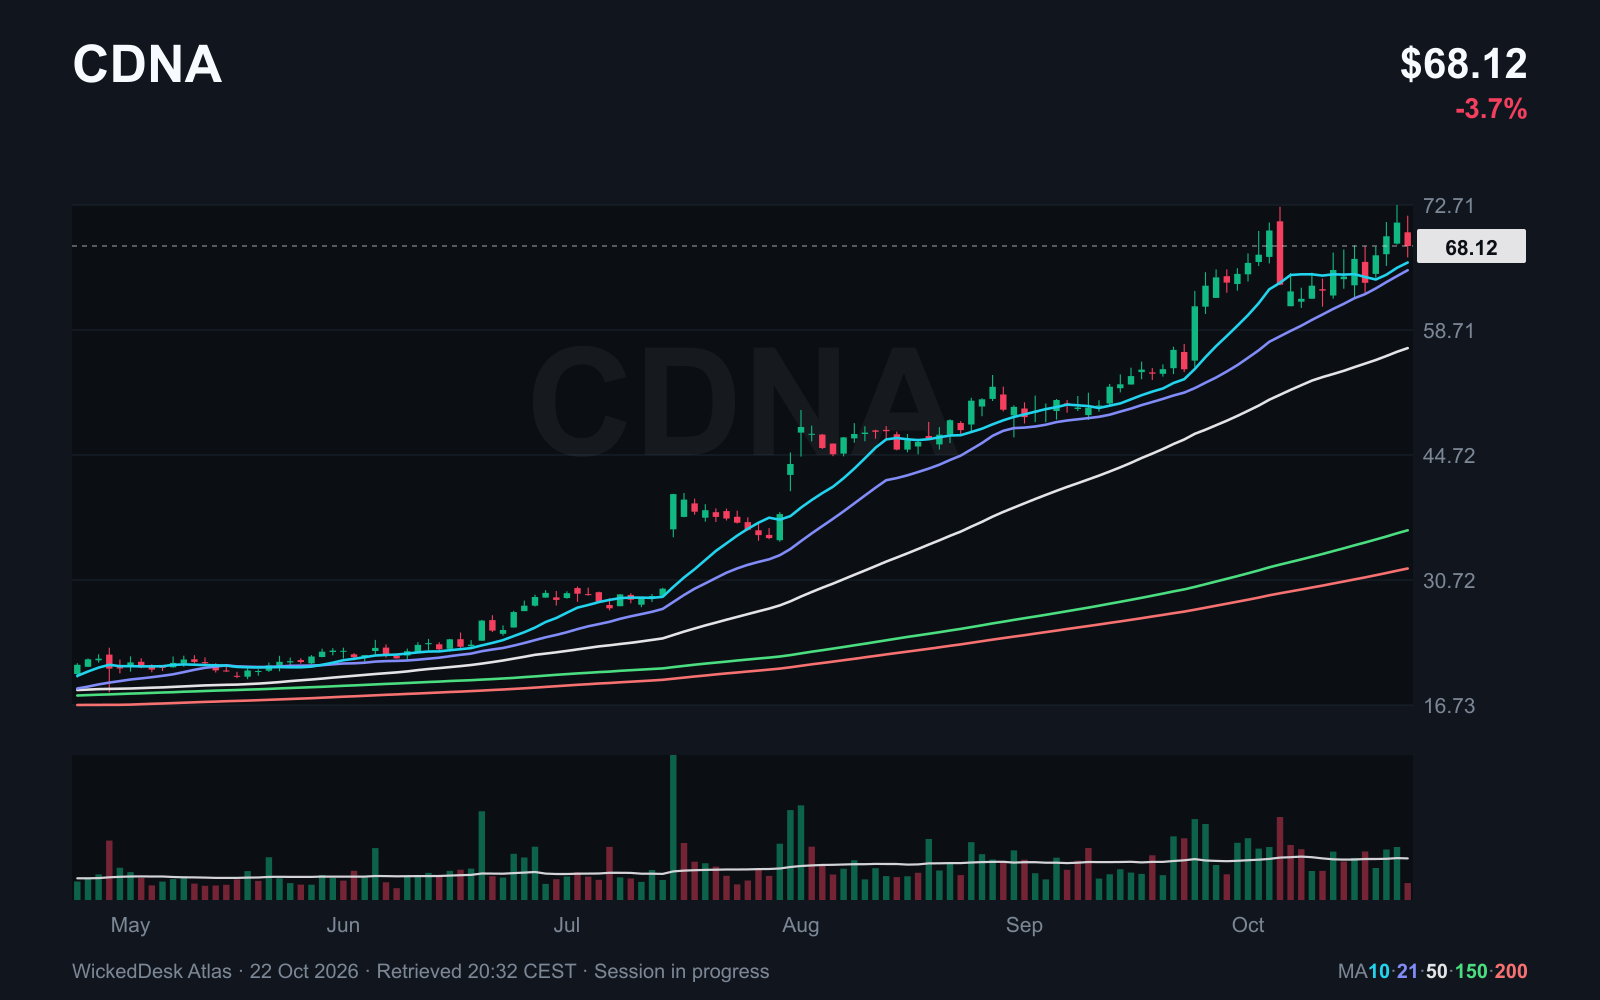
At $68.12, CDNA remains above its 21 day average at $65.41 and its 200 day average at $32.01. Despite a daily decline of 3.71%, it is still up 6.43% since Friday.
That is relative strength: the stock performs better than the broader market over the same period. It is not a guarantee about tomorrow. After a strong advance, individual pullbacks can be larger than a weekly performance number suggests.
Next, I want to see whether CareDx can hold its recent range and limit the decline. If it also falls decisively below its shorter averages, the case for more resilient performance weakens.
Okta gains for the week, but stays below its short average
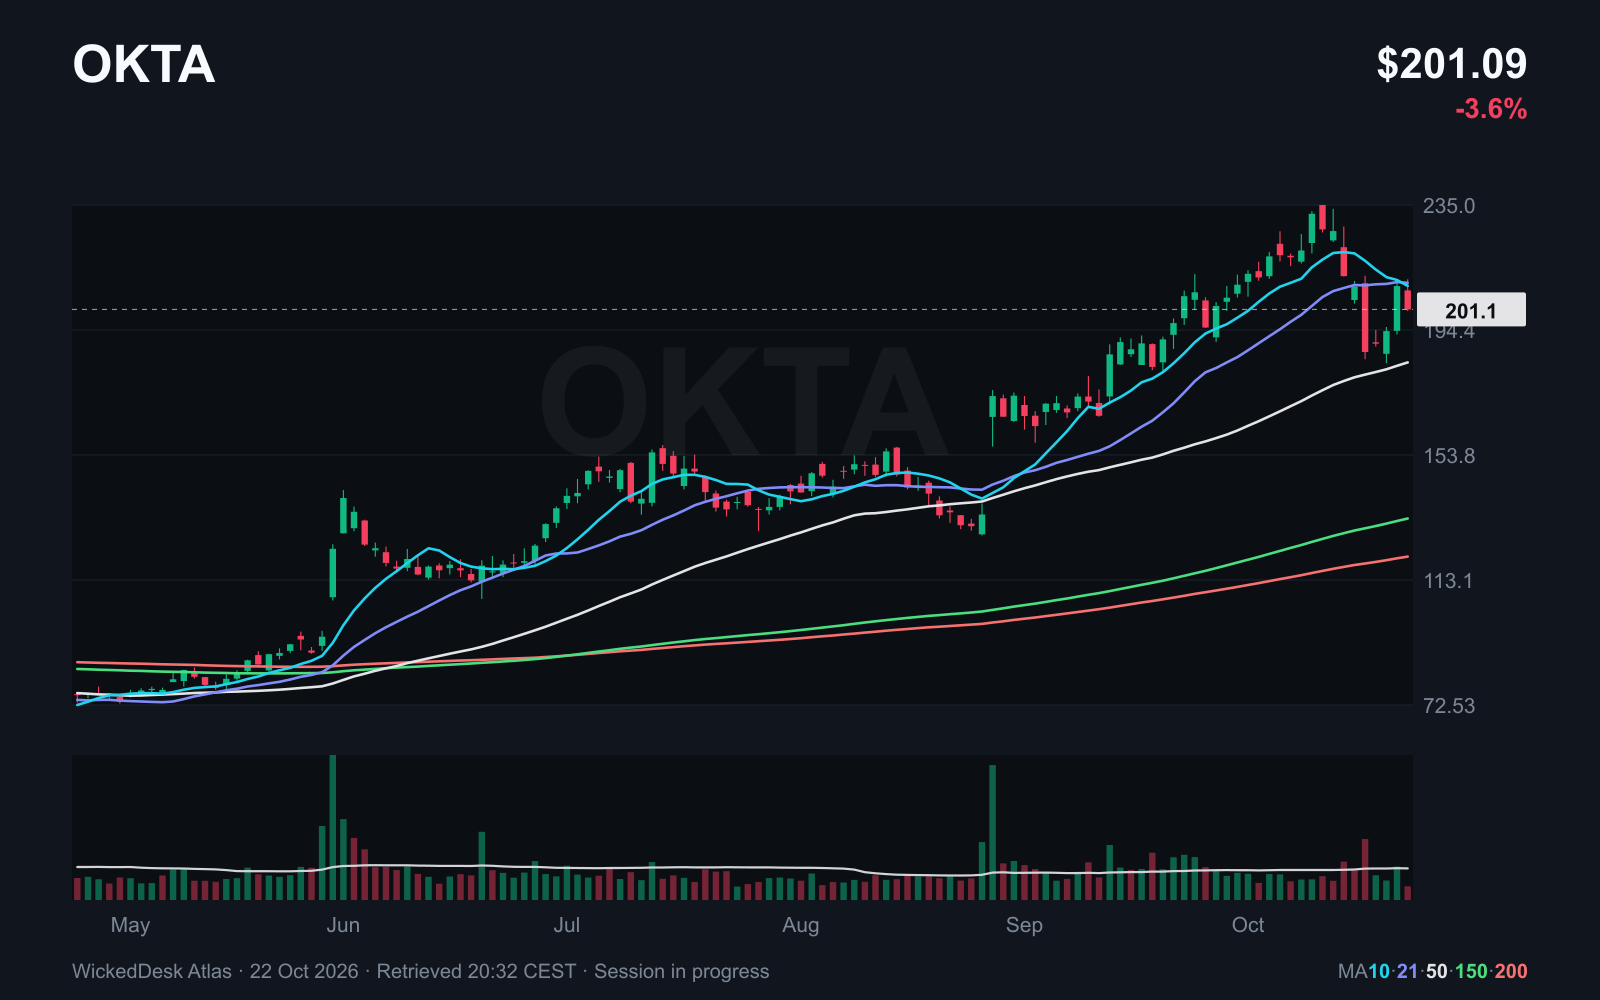
OKTA trades at $201.09, up 7.38% since Friday. Thursday takes back 3.62%. The stock is above its 50 day average at $183.84 but below its 21 day average at $209.73.
This is a recovery inside a previously damaged short term trend. A more convincing continuation would require buyers to return above the short average and then defend those prices. The weekly gain alone does not prove the decline is over.
CareDx and Okta therefore should not be treated as identical situations. Both have a weekly gain, but their positions relative to the shorter averages differ. That is why the chart comes after the list.
These names remain outside the narrower selection
Tesla, Netflix, Lam Research, Coinbase and Rocket Lab trade below their 200 day averages in our snapshot. Under the approach used here, we look for new long candidates above that longer term trend. This is a selection rule, not a claim that every stock below it is worthless or unsuitable for every investment strategy.
LRCX also stands out with an 11.43% daily decline. COIN falls 5.55%. A familiar company or an exciting future market does not replace missing price strength. A change in the chart would be needed to change the selection.
| Symbol | SMA 200 | Price USD | On Thursday | Since 16 Oct |
|---|---|---|---|---|
| TSLA | 386.65 | 376.49 | -2.58 % | +6.14 % |
| NFLX | 82.40 | 67.14 | +3.22 % | -4.81 % |
| LRCX | 283.30 | 231.01 | -11.43 % | -12.48 % |
| COIN | 180.90 | 167.25 | -5.55 % | -3.42 % |
| RKLB | 80.74 | 50.45 | -6.00 % | -0.77 % |
- SMA 200
- 386.65
- Price USD
- 376.49
- On Thursday
- -2.58 %
- Since 16 Oct
- +6.14 %
- SMA 200
- 82.40
- Price USD
- 67.14
- On Thursday
- +3.22 %
- Since 16 Oct
- -4.81 %
- SMA 200
- 283.30
- Price USD
- 231.01
- On Thursday
- -11.43 %
- Since 16 Oct
- -12.48 %
- SMA 200
- 180.90
- Price USD
- 167.25
- On Thursday
- -5.55 %
- Since 16 Oct
- -3.42 %
- SMA 200
- 80.74
- Price USD
- 50.45
- On Thursday
- -6.00 %
- Since 16 Oct
- -0.77 %
Financing stays expensive even when bonds rally
The latest retrieved official daily observations show a 5.12% yield on ten year US Treasuries and 4.79% on two year notes for 20 October. On 16 October they were 5.09% and 4.74%. These are dated daily observations, not live Thursday quotes. (Source: FRED: ten years), (Source: FRED: two years).
For businesses with large investment requirements, the next central bank decision is only one part of the picture. Funding maturities, credit spreads and refinancing dates matter too. Distant profits are worth less today when investors require higher interest rates in the meantime.
The labour market does not provide an unambiguous case for rapid relief either. Initial unemployment claims fall to 194,000 for the week ending 17 October, from a revised 200,000. Few layoffs are not the same as strong hiring. (Source: US Department of Labor).
One lower oil price does not solve the supply problem
WTI spot falls from $110.01 on 19 October to $107.89 on 20 October. That is still an elevated level. This series describes an American crude oil price, not European diesel. (Source: FRED and EIA).
On 20 October the EPA extends a temporary waiver covering certain fuel requirements in California and Arizona, citing supply and refining capacity problems. (Source: EPA notice).
Such measures can make fuel procurement easier, but they do not rebuild a damaged facility. Consumers and businesses need crude to be processed and delivered as usable fuel. If premiums for finished products remain high, a decline in crude prices will not fully reach the pump.
US gas storage is slightly above its usual seasonal level
The EIA reports 3,644 billion cubic feet of US working gas in storage for 16 October. That is 77 billion more than a week earlier and 1% above the five year average, but 4% below last year. The report was released on 22 October. (Source: EIA storage report).
Both comparisons are valid. Looking only at the weekly change shows seasonal storage building, not the whole supply picture for a cold winter. Weather, production and export demand still matter.
The US inventory cannot simply be applied to Europe. Exported American gas must be liquefied, shipped and delivered into the destination network. Well supplied US storage does not guarantee a low European gas price.
Bitcoin has not confirmed the recovery
Bitcoin trades at 81,235.36 USDT on Binance. That is down 0.47% from the 16 October UTC daily close and 3.40% on Thursday. The price is below its 50 calendar day average at 81,820.56 USDT. Ethereum, at 2,379.64 USDT, is also below its 50 day average.
Related equities are mixed. MSTR gains 5% since Friday but falls 6.39% on Thursday. COIN is down for the period and remains below its 200 day average. This is not yet a broad, shared upward move.
Crypto averages include weekends. USDT is the quote currency of this trading pair and is not presented as an identical dollar spot price. A more convincing continuation would need the coin and the stocks we follow to sustain their recoveries beyond a single day.
Gold, silver and long bonds move in different directions
Gold ETF GLD loses 3.16% since Friday, while silver ETF SLV falls 3.96%. TLT, which holds long dated US Treasuries, gains 2.30%. These are ETF price changes excluding distributions, not metal spot prices.
That illustrates the limits of a simple label such as inflation protection. Gold and silver can play a different role over many years than in the next weekly comparison. Silver also depends on industrial demand. Long bonds respond strongly to changing yield expectations and can rise even while absolute interest rates remain high.
The purpose of each position matters. Money needed soon should not depend on a volatile asset delivering protection in precisely that week.
Next week brings rate decisions and fresh earnings
The Fed’s next meeting ends on 28 October. The European Central Bank follows on 29 October. That same Thursday, the Bureau of Economic Analysis releases its first estimate of third quarter US growth and September personal income, spending and PCE prices. The PCE price index measures consumer spending prices and is particularly relevant to the Fed.
Sandisk and Illumina have also announced reports for 29 October. At Sandisk, I will compare memory demand and pricing with investment requirements. At Illumina, the question is whether the business results support the strength seen in some diagnostics stocks.
| Event | Date | Importance |
|---|---|---|
| Fed rate decision | 28 Oct | Reasoning behind the decision and inflation risks |
| European Central Bank rate decision | 29 Oct | Energy prices, borrowing costs and activity |
| US GDP and personal income and outlays | 29 Oct | Third quarter growth and September PCE prices |
| Sandisk and Illumina earnings | 29 Oct | Memory demand and diagnostics |
- Fed rate decision
- Date
- 28 Oct
- Importance
- Reasoning behind the decision and inflation risks
- European Central Bank rate decision
- Date
- 29 Oct
- Importance
- Energy prices, borrowing costs and activity
- US GDP and personal income and outlays
- Date
- 29 Oct
- Importance
- Third quarter growth and September PCE prices
- Sandisk and Illumina earnings
- Date
- 29 Oct
- Importance
- Memory demand and diagnostics
What would make next week look better
One positive opening session would not be enough for me. Selling pressure in Meta and the Nasdaq would need to ease while stronger stocks hold their recoveries. CareDx, Okta and our existing studies remain the specific reference points.
A better backdrop would be more credible if energy costs fell, businesses funded investment from growing cash generation and price strength spread across more stocks. If financing and energy stay expensive while margins or cash flows deteriorate, selection becomes harder. These are two conditions to test, not a prediction of next weekend’s market.
The important distinction this time is between growth and the money left after paying for it. That is what I will look for in the next reports. This magazine supports understanding and independent research; it is not personal investment advice.